SEO Title: Use PredictIndicators with TradingView – Boost Your Chart Insights
Meta Description: Discover how to combine PredictIndicators.ai with TradingView charts for smarter swing trading decisions. Learn step‑by‑step setup, workflow tips, and real‑world examples.
Target Keywords: PredictIndicators TradingView integration, AI trading signals TradingView, PredictIndicators AI, TradingView chart analysis, swing trading AI tools
URL Slug: tradingview-use-predictindicators-together-2026-03-12
Retail traders love TradingView for its beautiful charts, community scripts, and real‑time data. But when it comes to forecasting where an indicator will be in the next few bars, TradingView’s built‑in tools stop short. That’s where PredictIndicators.ai steps in.
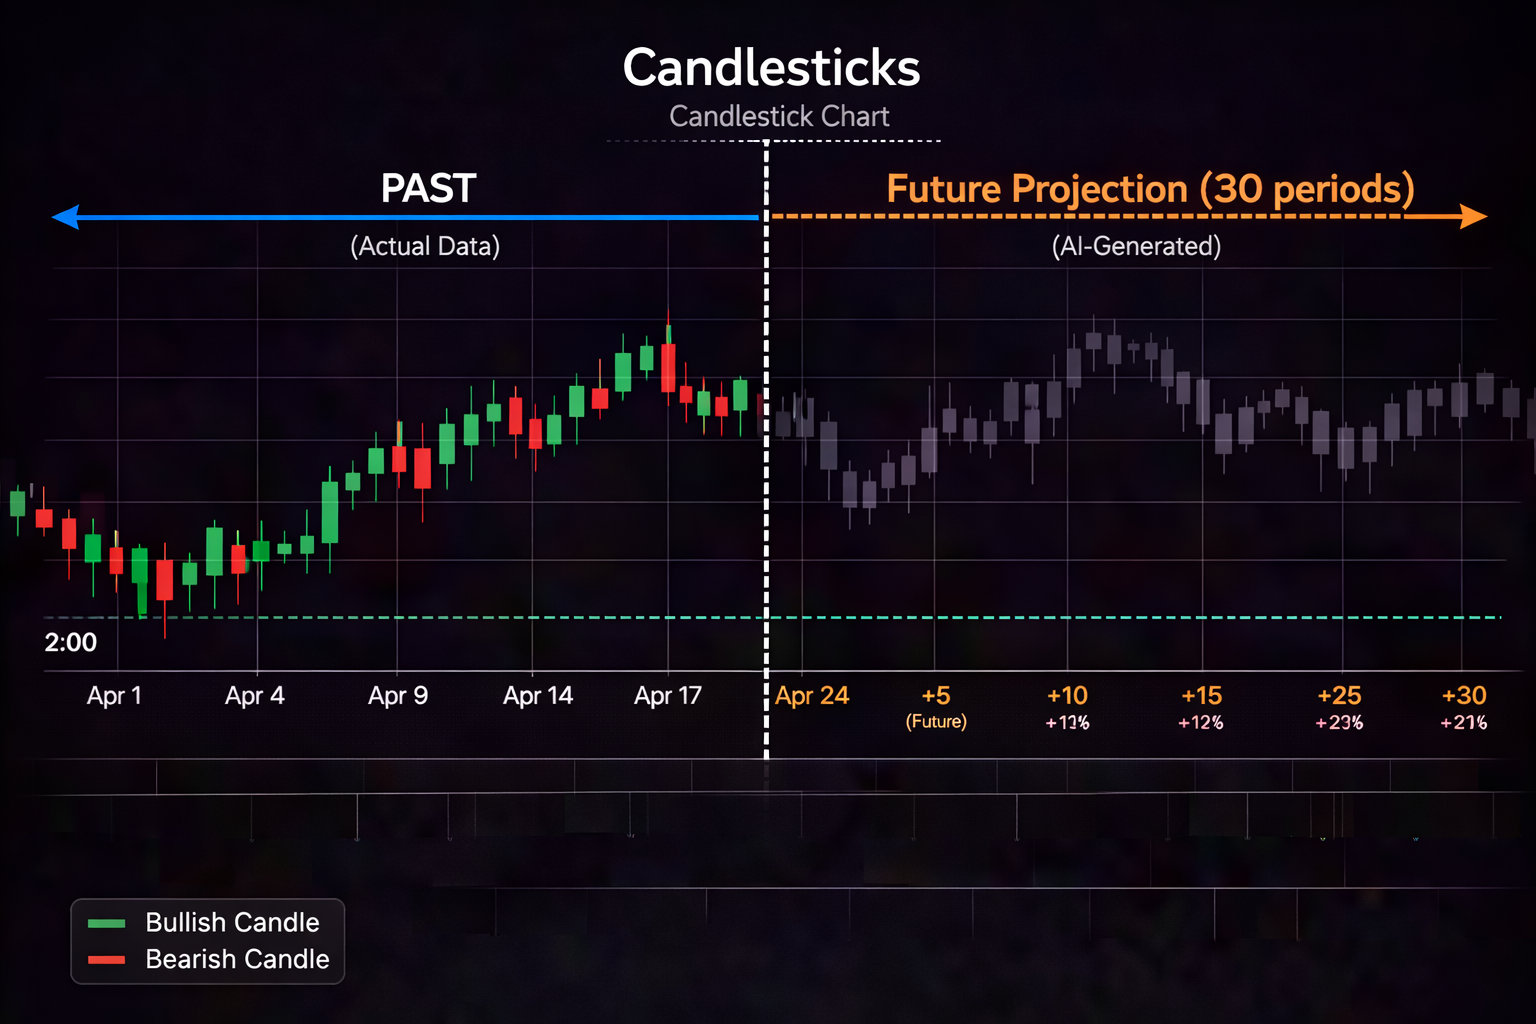
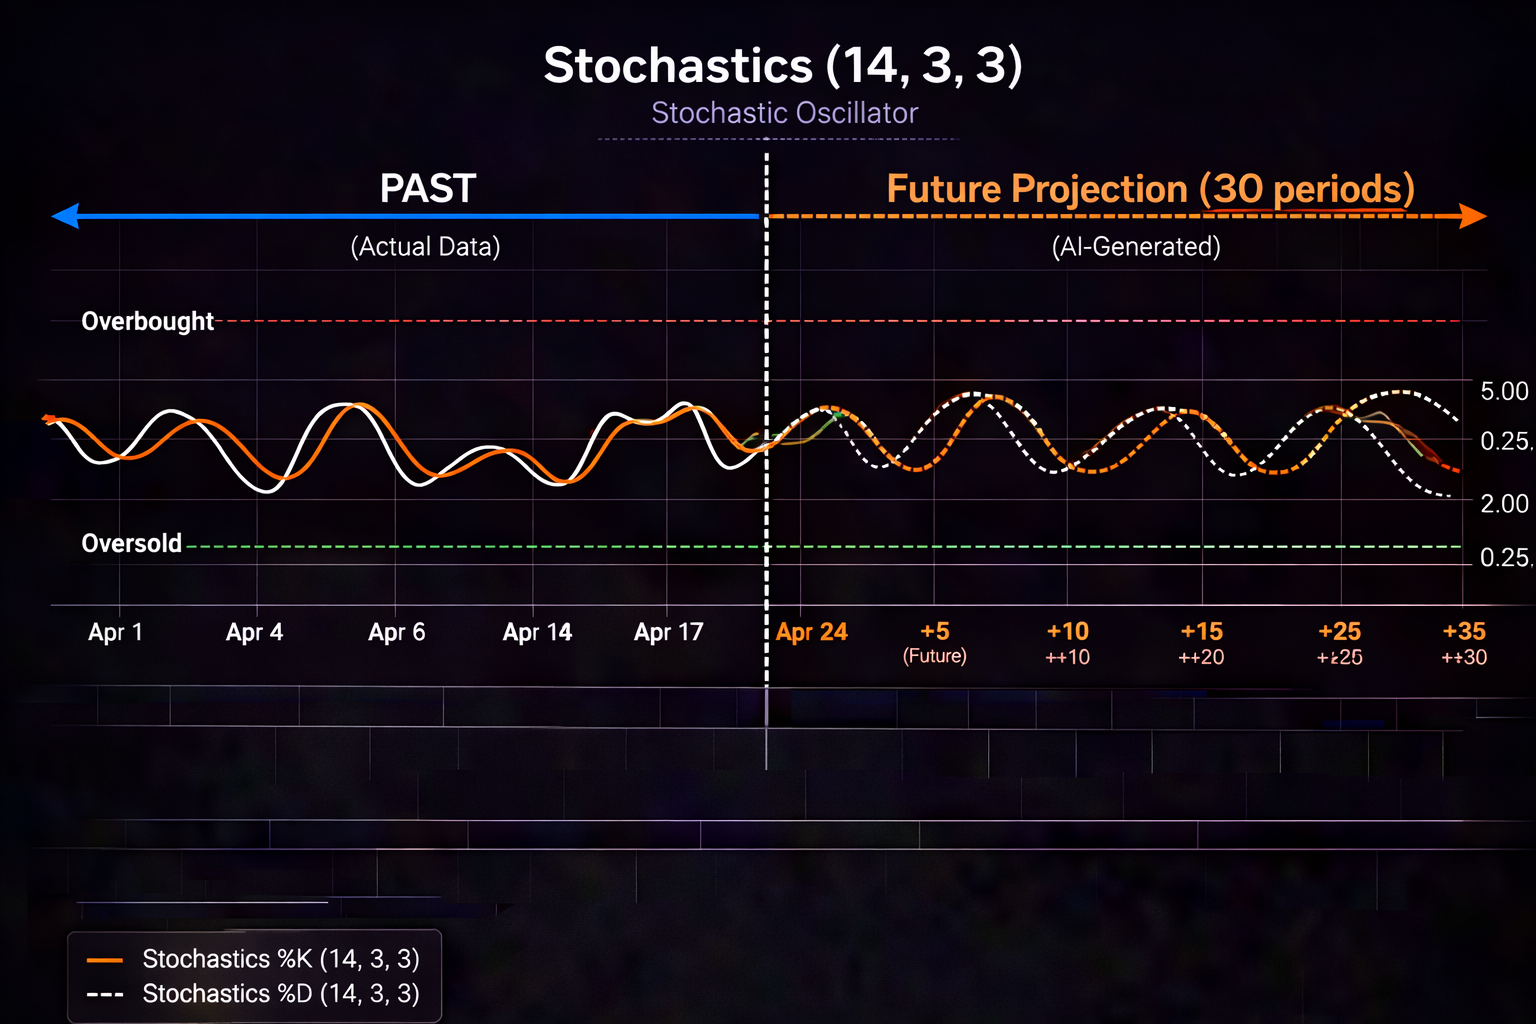
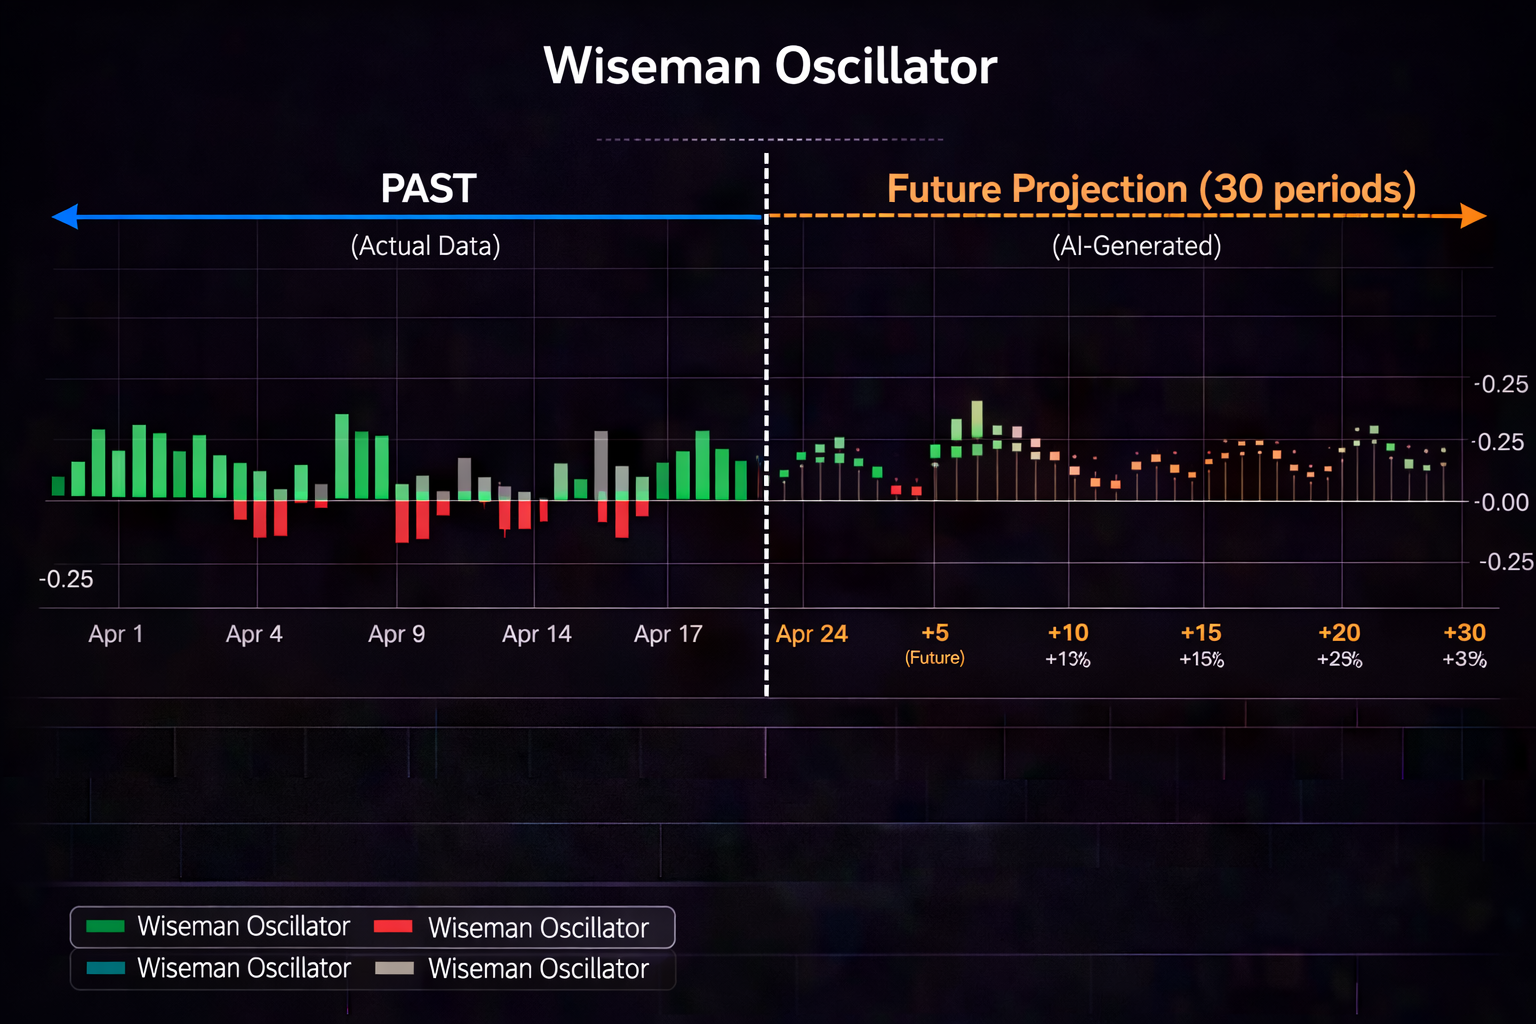
By feeding the same price data into PredictIndicators, you get AI‑generated forecasts for MACD, Stochastics, ATR, and more – up to 30 bars ahead. The best part? You can overlay those forecasts directly on your TradingView charts, giving you a clear visual cue of where the market might head.
In this guide we’ll walk through:
No machine‑learning jargon, no hype about percentages. Just a straightforward process that helps you make better decisions.
You’ll now see a small widget where you can paste your chart’s symbol (e.g., AAPL, EURUSD). The AI will start generating predictions in the background.
TradingView doesn’t have a native plugin for PredictIndicators, but you can embed the forecasts using the *Custom Indicator* feature and a simple webhook.
//@version=5
indicator("PredictIndicators Forecast", overlay=true)

// Replace with your API endpoint and token
url = "https://api.predictindicators.ai/forecast"
symbol = syminfo.tickerid

var table = request.security_lower_tf(symbol, "1", close)

// GET request – returns JSON with forecast values
forecast = request.get(url, "symbol=" + symbol + "&token=YOUR_TOKEN")

// Parse JSON (assumes {"macd": 0.45, "stoch": 70})
macdForecast = json.parse(forecast).macd
stochForecast = json.parse(forecast).stoch

plot(macdForecast, title="MACD Forecast", color=color.orange, linewidth=2)
plot(stochForecast, title="Stoch Forecast", color=color.purple, linewidth=2)
Replace YOUR_TOKEN with the token you received in the PredictIndicators dashboard.
Click Add to Chart. You’ll now see two new lines on the chart representing the AI’s predictions for MACD and Stochastics.
timeframe in the script ("1" stands for 1‑minute). For swing trading, 15‑minute or hourly frames work best.Let’s walk through a live chart of Apple (AAPL) on a 30‑minute timeframe.
By visualizing AI expectations directly on TradingView, you avoid the guesswork of “what will happen next.”
| Question | Answer |
|---|---|
| Do I need a paid PredictIndicators plan? | The free trial gives you 200 predictions per day – enough for occasional swing‑trading. Upgrade for unlimited forecasts. |
| Will the AI replace my analysis? | No. Think of it as a second opinion that highlights where the indicators may be headed. Use it alongside your own chart reading. |
| Is the integration safe? | Yes. The plugin only reads public market data and never accesses your personal accounts. |
Ready to level up your chart analysis? Try PredictIndicators.ai today and get a 30‑day free trial. Use the code TVINTEGRATE at checkout.
Visit https://predictindicators.ai/trial to claim your free trial. Join our influencer program at https://predictindicators.ai/influencer and earn commissions for every trader you bring on board.
Written by Robert, founder of PredictIndicators.ai.
🚀 Unlock AI‑powered forecasts on your TradingView charts! Learn how to overlay PredictIndicators.ai predictions for smarter swing trades. #TradingView #AI #SwingTrading https://predictindicators.ai/hub/blog/tradingview-use-predictindicators-together-2026-03-12
📈 Want to see where MACD and Stochastics are heading? Combine PredictIndicators.ai with TradingView and trade with confidence. Free trial inside! #TraderCommunity #AITrading https://predictindicators.ai/trial