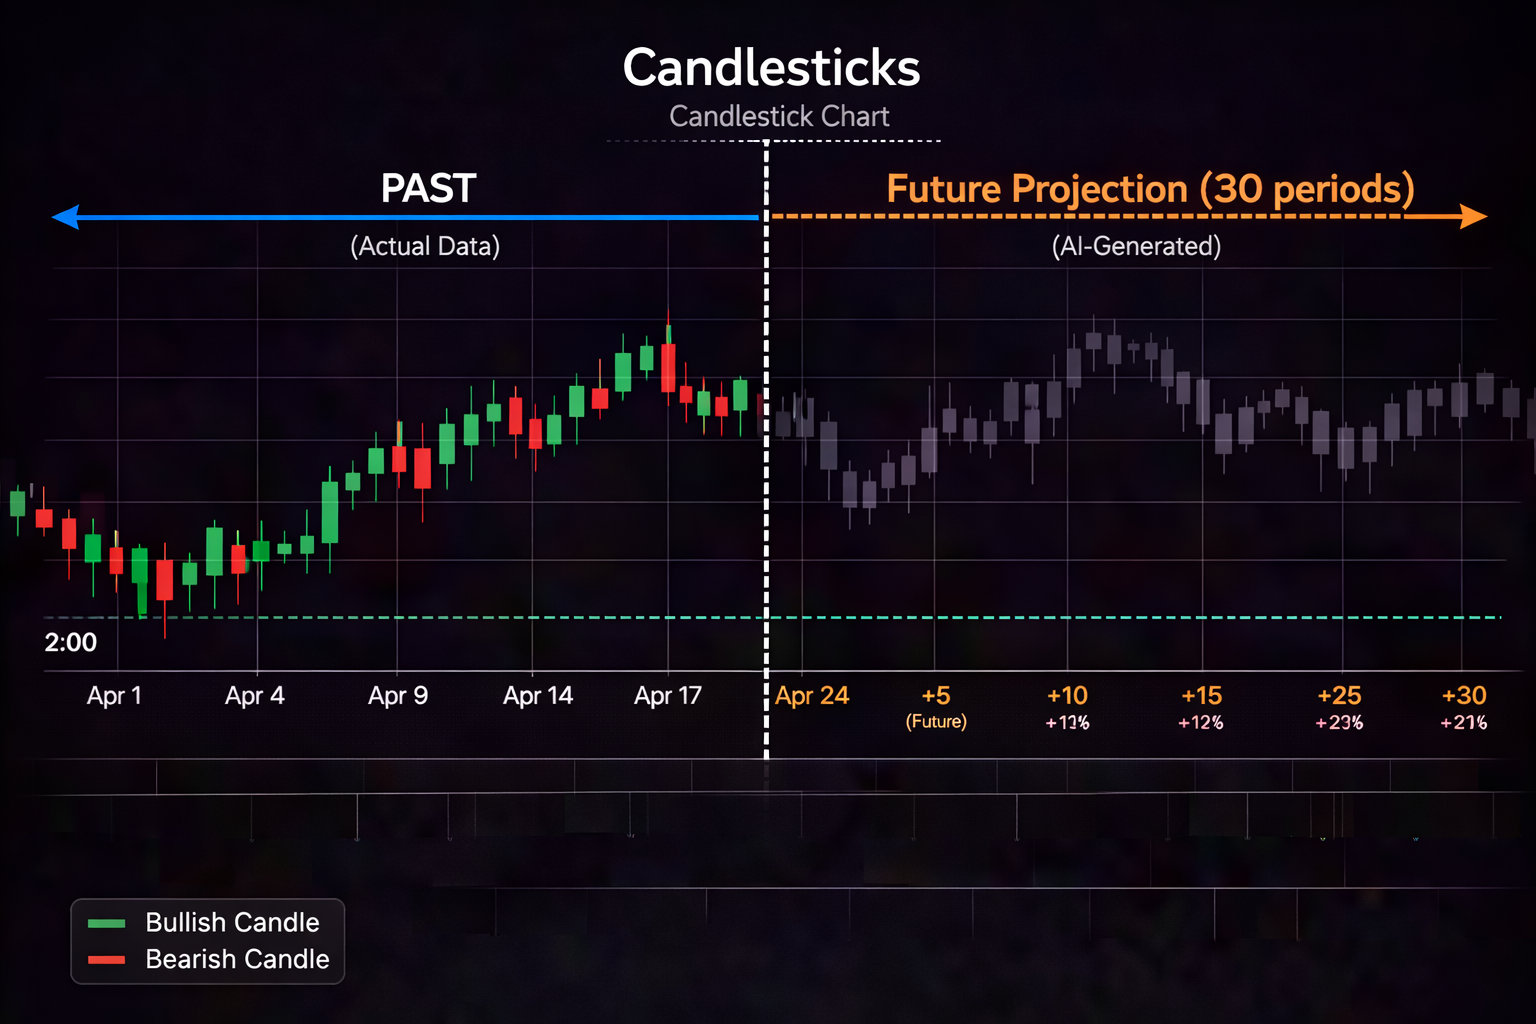
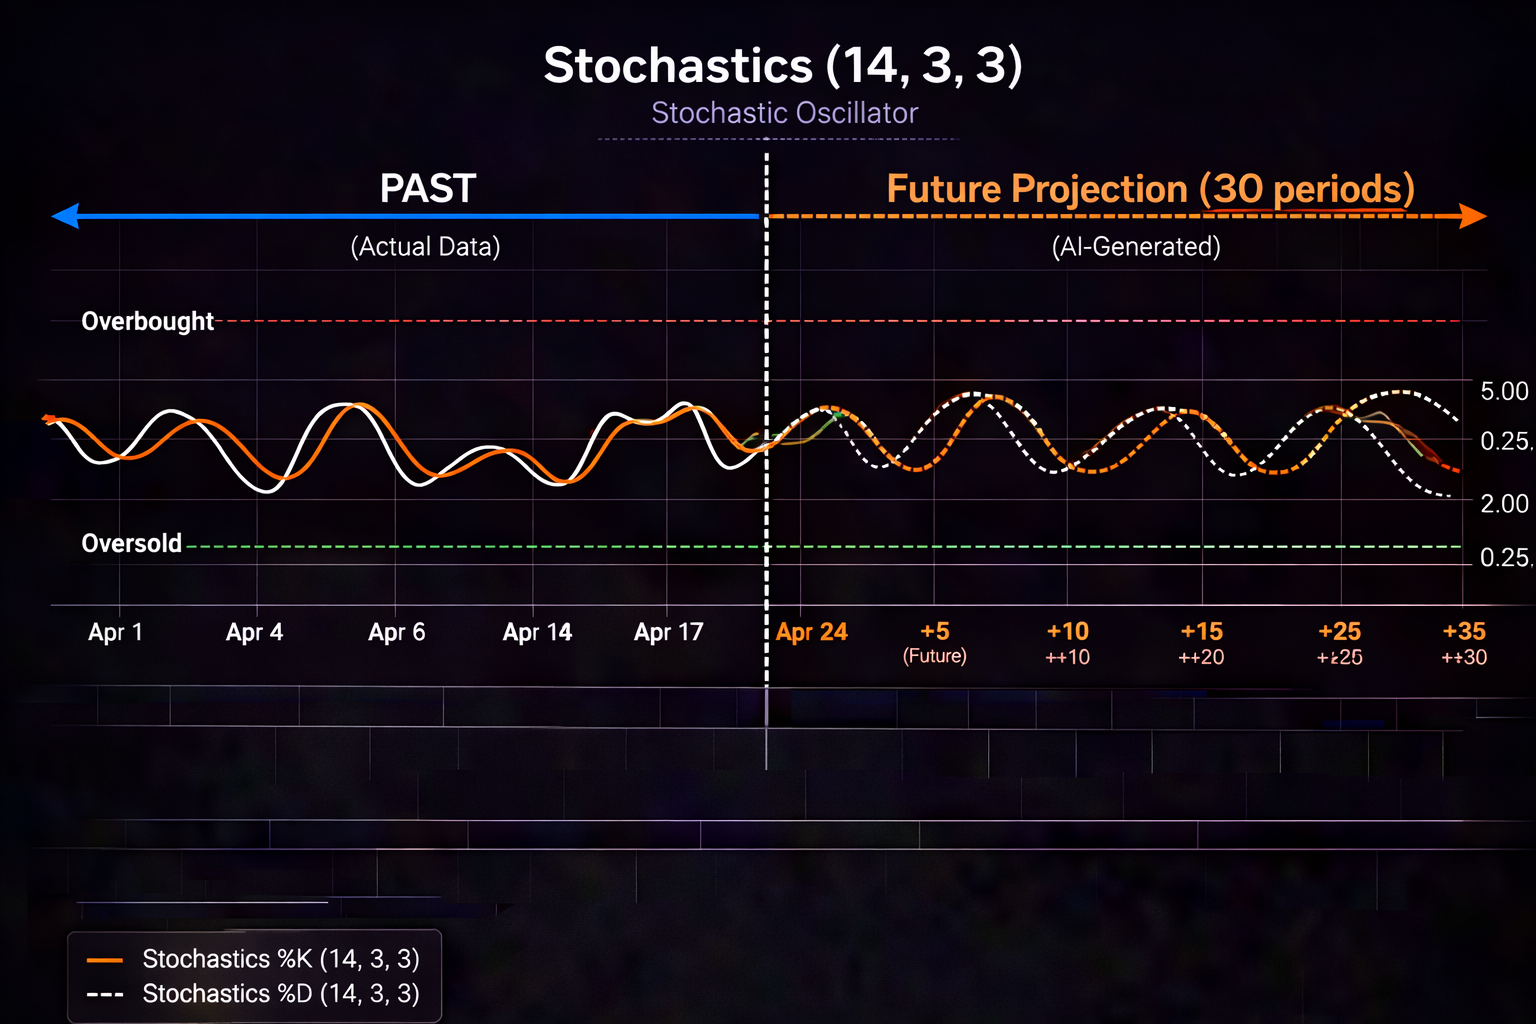
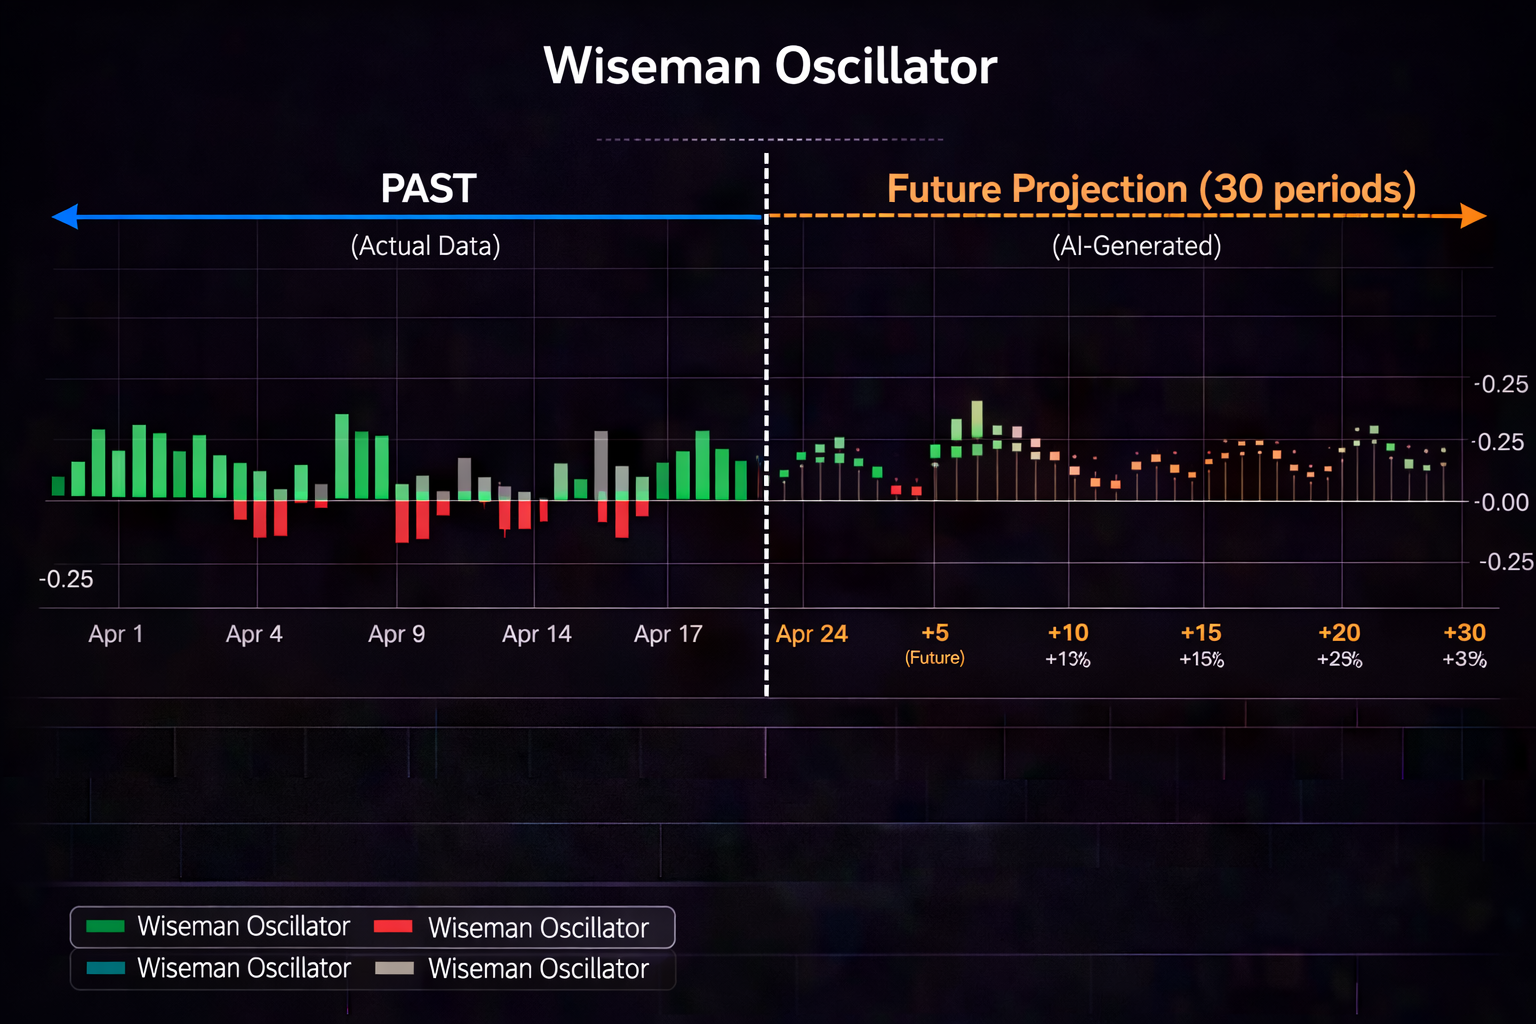
If you spend any time on TradingView, you know its charts are unmatched for visual analysis. But what if you could layer AI‑driven forecasts over those charts, getting a heads‑up on where key indicators are likely to move? That’s exactly what PredictIndicators.ai brings to the table.
In this guide we’ll walk through:
Setting up PredictIndicators alongside TradingView.
Using the browser extension to overlay AI signals.
A step‑by‑step workflow that keeps you in the TradingView ecosystem while benefiting from PredictIndicators’ predictions.
Tips for swing traders to turn those signals into actionable trades.
By the end you’ll have a seamless, platform‑integrated workflow that saves you time and sharpens your edge.
Why Combine PredictIndicators with TradingView?
TradingView excels at visualizing price action, drawing trendlines, and sharing ideas. PredictIndicators.ai excels at forecasting the next 30‑bars for popular indicators such as MACD, Stochastics, ATR, and more. When combined, you get:
Immediate context: AI forecasts appear right on the chart you’re already analyzing.
Consistent data: No need to switch between a desktop app and a web page.
Better swing‑trade timing: Use the AI signal to confirm setups you spot on TradingView.
The result is a smoother decision‑making loop that keeps you focused on the market instead of juggling tools.
Step 1: Install the PredictIndicators Browser Extension
Visit the PredictIndicators.ai website and click “Add to Chrome/Edge/Firefox”.
Follow the prompts to install the extension (takes under a minute).
Once installed, click the extension icon and sign in with your PredictIndicators account.
Tip: The extension works on any modern browser, and it automatically detects TradingView pages.
Step 2: Connect the Extension to Your TradingView Chart
Open your preferred chart on TradingView.
In the extension popup, click “Enable on this site”.
Choose the indicator you want AI forecasts for – e.g., MACD or Stochastics.
Adjust the forecast horizon (default is 30 bars). You can shorten it for intraday charts or extend it for daily views.
The AI overlay appears as a faint line above the standard indicator, color‑coded:
Green – bullish forecast.
Red – bearish forecast.
Gray – neutral/indeterminate.
Step 3: Build a Working Trading Routine
a. Scan for High‑Probability Setups
Use TradingView’s screener to find symbols that meet your technical criteria (e.g., MACD crossover, oversold Stochastics). Open the chart and activate the PredictIndicators overlay.
b. Confirm with the AI Signal
If the AI line turns green shortly after a bullish candlestick pattern, you have a double confirmation – a classic “signal + forecast” combo. If the AI line is red while you see a potential bullish setup, consider waiting until the AI flips or look for a different ticker.
c. Set Alerts
In TradingView, click Alerts → Add Alert. Choose “PredictIndicators Forecast” as the condition (the extension adds this option). Set the alert to trigger when the forecast changes direction – this keeps you notified without staring at the screen.
Practical Example: Swing‑Trading the S&P 500 Index
Chart: SPX on a 4‑hour timeframe.
Technical trigger: MACD line crosses above the signal line while price holds above the 50‑EMA.
AI overlay: The PredictIndicators MACD forecast line turns green and stays above the signal for the next 20 bars.
Decision: Enter a long position with a stop just below the recent swing low.
Exit: Use the AI forecast to anticipate a reversal – when the line flips red, consider taking profit or tightening stops.
By pairing the visual cue (MACD crossover) with the AI forecast, you reduce the likelihood of false signals and improve timing.
Advanced Tips for Swing Traders
Multiple Indicators: Overlay AI forecasts for both MACD and Stochastics. Consistent bullish signals across them strengthen confidence.
Time‑frame Alignment: Use a higher‑timeframe chart for the AI forecast (e.g., daily) while executing trades on a lower timeframe (4‑hour). This gives a broader market view.
Risk Management: Always set stop‑losses based on price structure, not AI. The AI is a guide, not a guarantee.
Back‑test: Use the PredictIndicators “History” mode to see how past forecasts would have played out on your favourite symbols.
Frequently Asked Questions
Q: Do I need a paid PredictIndicators subscription? A: The free tier gives you forecasts for up to three symbols per day. For unlimited access and premium alert features, upgrade via the app.
Q: Will the AI overlay affect TradingView’s performance? A: The extension adds a lightweight overlay; most users report no lag. If you notice slowdown, try disabling forecasts on less‑important charts.
Q: Can I use this on mobile? A: Yes! The PredictIndicators mobile app syncs your settings, so you can view AI forecasts on the TradingView iOS/Android app.
Call to Action
Ready to trade smarter? Start your free trial of PredictIndicators.ai today and instantly boost your TradingView workflow.
Tweet 1: 🚀 Combine the power of #TradingView charts with AI forecasts from @PredictIndicators! See bullish signals before they happen. Try the free trial now 👉 https://predictindicators.ai/free-trial #SwingTrading #AI #Charts
Tweet 2: 📈 Want smarter swing trades? Overlay PredictIndicators’ AI predictions directly on your TradingView charts. No extra windows, just better decisions. 🎯 https://predictindicators.ai/free-trial #Trading #Investing