Technical Analysis Mastery Guide: Enhance Your Chart Reading with AI-Powered Forecasting
Technical analysis is the language of traders. It's how we read market sentiment, identify opportunities, and make informed decisions about entries and exits. For decades, traders have relied on chart patterns, candlestick formations, and technical indicators to gain an edge. But in 2026, reading charts with only traditional tools is like navigating with a paper map when everyone else has GPS.
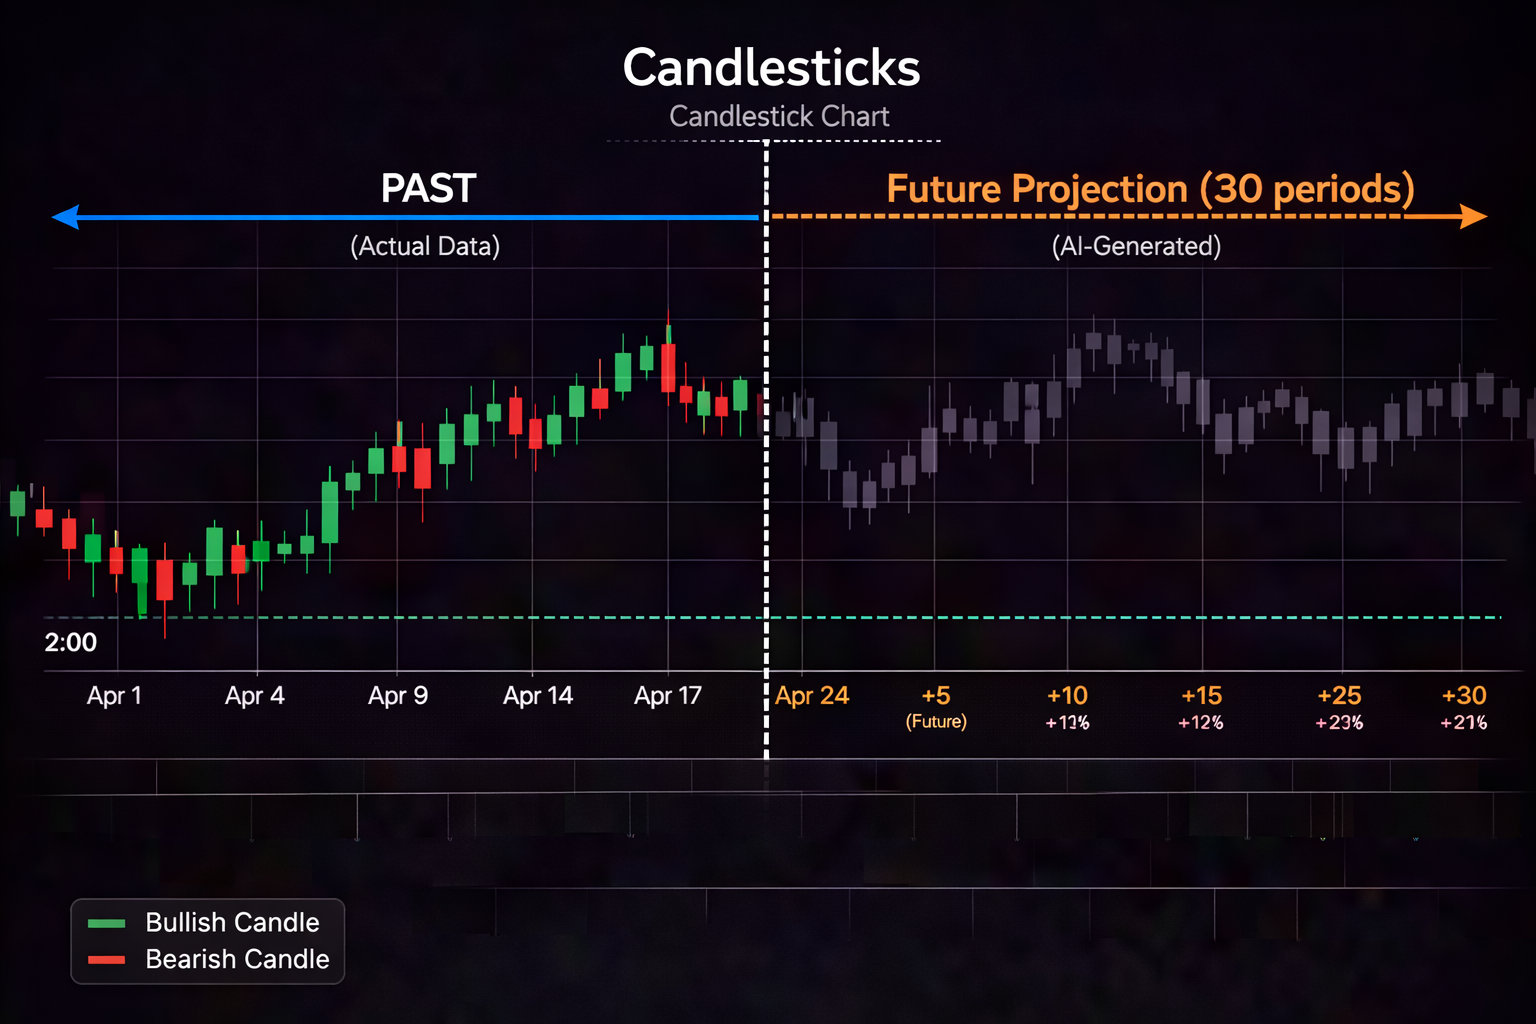
AI-powered forecasting is transforming technical analysis from a purely backward-looking discipline into a forward-looking science. Instead of just identifying patterns after they form, AI can forecast where indicators and price action are heading 20-30 bars into the future. This doesn't replace traditional technical analysis—it supercharges it.
In this comprehensive guide, we'll cover everything you need to master technical analysis in the modern era: classic chart patterns, essential indicators, and how to integrate AI forecasting tools like PredictIndicators.ai to make better, more confident trading decisions across all platforms—NinjaTrader 8, MetaTrader 5, iPhone, iPad, Android, Mac, and web.
Foundation: What Technical Analysis Really Is
Before diving into patterns and indicators, let's clarify what technical analysis is—and what it isn't.
The Three Pillars of Technical Analysis
Technical analysis rests on three core assumptions:
1. Price Discounts Everything
All known information—fundamentals, news, sentiment, economic data—is already reflected in the current price. You don't need to analyze earnings reports or economic indicators separately; the price action incorporates all of it.
2. Price Moves in Trends
Markets aren't random. They trend upward, downward, or sideways. Technical analysis aims to identify trends early and trade in their direction until evidence suggests the trend has reversed.
3. History Tends to Repeat
Market psychology doesn't change. Fear, greed, hope, and panic drive markets today just as they did 100 years ago. Because human psychology is constant, chart patterns and price formations repeat over time.
What Technical Analysis Is NOT
Not a crystal ball: TA provides probabilities, not certainties
Not a standalone system: Best combined with risk management and market context
Not immune to false signals: Patterns fail, indicators give bad reads—this is normal
Not a replacement for discipline: Great TA with poor risk management still loses money
Essential Chart Patterns Every Trader Must Know
Chart patterns are recurring formations that signal likely future price direction. Here are the most reliable patterns you need to master:
Reversal Patterns
These signal that the current trend is exhausting and likely to reverse.
Head and Shoulders
Structure: Three peaks—left shoulder, head (highest), right shoulder
Signal: Bearish reversal after uptrend
Entry: Break below neckline (line connecting the lows between shoulders and head)
Target: Distance from head to neckline, projected downward from breakout
AI Enhancement: Use AI forecasts to confirm whether momentum indicators support the bearish reversal thesis before entering
Inverse Head and Shoulders
Structure: Mirrored head and shoulders—three troughs
Signal: Bullish reversal after downtrend
Entry: Break above neckline
Target: Distance from head to neckline, projected upward from breakout
Double Top
Structure: Two peaks at similar price level
Signal: Bearish reversal
Entry: Break below the trough between the two peaks
Target: Height of pattern projected downward
Double Bottom
Structure: Two troughs at similar price level
Signal: Bullish reversal
Entry: Break above the peak between the two troughs
Target: Height of pattern projected upward
Continuation Patterns
These signal that the current trend is pausing but likely to resume.
Bull Flag
Structure: Sharp upward move (flagpole) followed by downward-sloping consolidation (flag)
Signal: Bullish trend continuation
Entry: Break above upper flag boundary
Target: Length of flagpole projected upward from breakout
AI Enhancement: AI forecasts showing continued bullish momentum increase confidence in flag breakout
Bear Flag
Structure: Sharp downward move followed by upward-sloping consolidation
Signal: Bearish trend continuation
Entry: Break below lower flag boundary
Target: Length of flagpole projected downward
Ascending Triangle
Structure: Flat resistance at top, rising trendline at bottom
Signal: Typically bullish breakout
Entry: Break above horizontal resistance
Target: Height of triangle at widest point, projected from breakout
Descending Triangle
Structure: Flat support at bottom, descending trendline at top
Signal: Typically bearish breakdown
Entry: Break below horizontal support
Symmetrical Triangle
Structure: Converging trendlines from both tops and bottoms
Signal: Breakout direction determines bias (can break either way)
Entry: Wait for confirmed breakout with volume
AI Enhancement: AI momentum forecasts can help predict breakout direction before it occurs
Candlestick Patterns
Individual or multi-candle formations that signal short-term reversals or continuations.
Doji
Structure: Open and close at or very near the same price
Signal: Indecision, potential reversal after strong move
Confirmation: Wait for next candle to confirm direction
Hammer / Hanging Man
Structure: Small body at top, long lower wick (2-3× body length)
Hammer (after downtrend): Bullish reversal
Hanging Man (after uptrend): Bearish reversal
Engulfing Patterns
Bullish Engulfing: Large green candle completely engulfs prior red candle
Bearish Engulfing: Large red candle completely engulfs prior green candle
Signal: Strong reversal signal, especially at key support/resistance
Morning Star / Evening Star
Morning Star (3 candles): Long red, small-bodied (star), long green → Bullish reversal
Evening Star (3 candles): Long green, small-bodied (star), long red → Bearish reversal
Core Technical Indicators
Indicators are mathematical calculations applied to price and volume. Here are the essential ones every trader should master:
Trend-Following Indicators
Moving Averages (MA)
What it does: Smooths price data to show trend direction
Common periods:
20-period (short-term trend)
50-period (intermediate trend)
200-period (long-term trend)
Signals:
Price above MA = bullish
Price below MA = bearish
Golden Cross (50 crosses above 200) = bullish
Death Cross (50 crosses below 200) = bearish
AI Enhancement: Traditional moving averages lag price. AI forecasts can predict where moving averages are heading 20-30 bars in advance, allowing you to position before crossovers occur.
MACD (Moving Average Convergence Divergence)
What it does: Shows relationship between two moving averages of price
Components:
MACD line (12-period EMA minus 26-period EMA)
Signal line (9-period EMA of MACD line)
Histogram (difference between MACD and signal lines)
Signals:
MACD crosses above signal line = bullish
MACD crosses below signal line = bearish
MACD above zero = bullish momentum
MACD below zero = bearish momentum
Divergence (price makes new high, MACD doesn't) = potential reversal
Momentum Oscillators
RSI (Relative Strength Index)
What it does: Measures speed and magnitude of price movements
Scale: 0 to 100
Signals:
RSI above 70 = overbought (potential pullback)
RSI below 30 = oversold (potential bounce)
Divergence = potential reversal signal
RSI failing to reach overbought in uptrend = weakening momentum
AI Enhancement: PredictIndicators.ai forecasts RSI peaks and troughs 20-30 bars ahead, allowing you to anticipate overbought/oversold conditions before they occur.
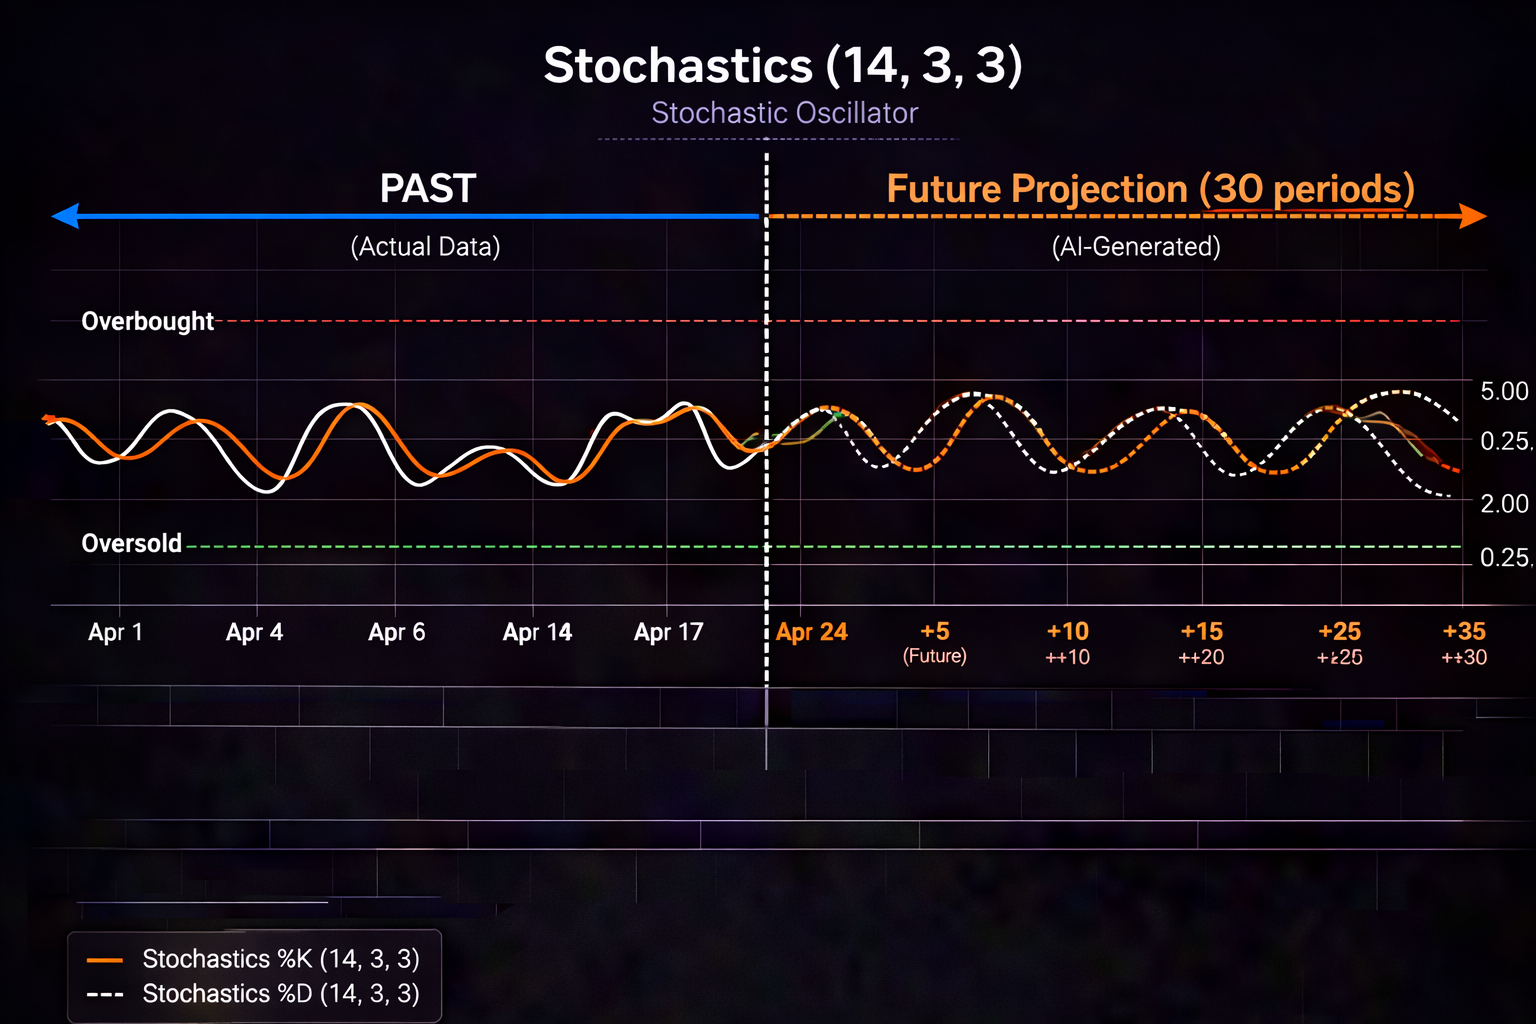
Stochastics
What it does: Compares closing price to price range over a period
Components:
%K line (fast stochastic)
%D line (slow stochastic, EMA of %K)
Signals:
Above 80 = overbought
Below 20 = oversold
%K crosses above %D = bullish
%K crosses below %D = bearish
Volatility Indicators
Bollinger Bands
What it does: Shows price relative to standard deviation bands
Components:
Middle band: 20-period SMA
Upper band: 2 standard deviations above middle
Lower band: 2 standard deviations below middle
Signals:
Price touching upper band = potentially overbought
Price touching lower band = potentially oversold
Bands expanding = volatility increasing
Bands contracting = volatility decreasing (often precedes big moves)
ATR (Average True Range)
What it does: Measures volatility, not direction
Uses:
Stop loss placement (e.g., 2 × ATR below entry)
Position sizing (reduce size when ATR is high)
Profit targets based on expected volatility
AI Enhancement: AI forecasting of ATR allows proactive position sizing adjustments. If AI predicts ATR expansion, reduce size before volatility increases.
Volume Indicators
Volume
What it does: Shows number of shares/contracts traded
Signals:
High volume on breakouts = confirmation
Low volume on breakouts = suspect, potential false move
Rising volume in uptrend = healthy
Declining volume in uptrend = weakening
On-Balance Volume (OBV)
What it does: Cumulative volume indicator that adds volume on up days, subtracts on down days
Signals:
OBV trending with price = trend confirmed
OBV diverging from price = potential reversal
AI-Enhanced Technical Analysis: The Modern Edge
Traditional technical analysis is reactive. AI-powered forecasting makes it proactive. Here's how AI transforms each aspect of TA:
1. Predictive Indicator Analysis
Traditional approach: Wait for MACD to cross above signal line, then enter.
AI approach: AI forecasts show MACD will cross above signal line in 8 bars. Prepare entry now, enter on confirmation.
Advantage: Better entry prices, earlier positioning, more confidence in setups.
2. Multi-Indicator Synthesis
Traditional approach: Check MACD, then RSI, then Stochastics separately. Try to reconcile conflicting signals mentally.
AI approach: AI analyzes all indicators simultaneously and provides unified forecast: "Bullish momentum expected for next 25 bars based on MACD, RSI, and Stochastics alignment."
Advantage: Holistic view, no analysis paralysis, clearer decision-making.
3. Pattern Confirmation
Traditional approach: Identify bullish flag pattern. Enter on breakout. Hope it works.
AI approach: Identify bullish flag. Check AI forecasts—do they show strengthening momentum during the consolidation? If yes, breakout has higher probability. If AI shows weakening momentum, be cautious.
Advantage: Filters out low-probability patterns, focuses on high-quality setups.
4. Dynamic Support and Resistance
Traditional approach: Draw static support/resistance lines based on historical price.
AI approach: Use AI volatility forecasts to project where dynamic support/resistance (like moving averages, Bollinger Bands) will be in 20-30 bars.
Advantage: Anticipate where price is likely to react, not just where it has reacted before.
5. Divergence Detection
Traditional approach: Manually scan for divergences between price and indicators.
AI approach: AI automatically detects and alerts on developing divergences, often before they're obvious to the human eye.
Advantage: Earlier warning of potential reversals, no missed opportunities from manual scanning.
Building Your Technical Analysis Framework
Now let's put it all together into a practical framework you can use daily.
Step 1: Multi-Timeframe Analysis
Never analyze just one timeframe. Use at least three:
Higher timeframe (trend bias): 1-hour or 4-hour charts for swing trading; 15-minute for day trading
Trading timeframe (setup identification): 15-minute for swing trading; 5-minute for day trading
Entry timeframe (precision timing): 5-minute for swing trading; 1-2 minute for day trading
Rule: Only take trades in the direction of the higher timeframe trend unless you're an experienced counter-trend trader.
Step 2: Top-Down Analysis Process
Start with price action: What's the trend? Where are key support/resistance levels? What patterns are forming?
Add trend indicators: Where is price relative to moving averages? What's MACD showing?
Check momentum: RSI, Stochastics—are they overbought/oversold? Any divergences?
Assess volatility: What's ATR telling you about expected range? Are Bollinger Bands expanding or contracting?
Confirm with volume: Is volume supporting the move?
Layer in AI forecasts: What do AI predictions show for the next 20-30 bars across all indicators?
Step 3: Create a Technical Analysis Checklist
Before entering any trade, verify:
□ Trend direction on higher timeframe is clear
□ Trade is aligned with higher timeframe trend (or strong counter-trend rationale exists)
□ Key support/resistance levels are identified
□ Chart pattern (if any) is clearly defined
□ Moving averages confirm trend direction
□ MACD supports trade direction
□ RSI is not in extreme overbought/oversold against your trade
□ AI forecasts align with trade thesis for next 20-30 bars
□ Stop loss is at logical technical level
□ Reward-to-risk is at least 2:1
Platform-Specific Technical Analysis
Different trading platforms offer different TA capabilities. Here's how to maximize technical analysis on each:
NinjaTrader 8
Best for: Futures traders, advanced charting, custom indicators
Strengths:
SuperChart feature allows multiple instruments on one chart
Extensive custom indicator library
Strategy Builder for backtesting TA-based systems
AI tools like PredictIndicators.ai integrate directly
Setup tips:
Use chart templates to save your favorite indicator combinations
Set up multi-chart workspaces for multi-timeframe analysis
Create hotkeys for quickly drawing trendlines and horizontal levels
MetaTrader 5
Best for: Forex traders, multi-asset trading, automated strategies
Strengths:
Built-in technical indicators (80+ standard indicators)
Custom indicator support via MQL5
Multi-currency charts and analysis
Strategy Tester for backtesting
AI indicator integration available
Setup tips:
Use chart profiles to switch between different indicator setups quickly
Set up alert notifications for indicator crossovers and levels
Use the Economic Calendar integration to be aware of news events
Mobile Platforms (iPhone, iPad, Android)
Best for: Monitoring positions, quick analysis on the go
Strengths:
Access to charts and AI forecasts anywhere
Push notifications for key levels and signals
Touch-friendly drawing tools
Limitations:
Smaller screen real estate limits multi-chart analysis
Drawing tools less precise than desktop
Best practices:
Use mobile for monitoring and alerts, not primary analysis
Pre-define key levels on desktop, then monitor on mobile
Keep chart templates simple on mobile (3-4 indicators max)
Mac and Web Platforms
Best for: Traders who prefer macOS or need browser-based access
Advantages:
Full-featured charting comparable to Windows platforms
Cross-device synchronization
No installation required (web)
Modern AI tools like PredictIndicators.ai work seamlessly across all these platforms, giving you consistent forecasting whether you're on desktop or mobile.
Common Technical Analysis Mistakes
Mistake 1: Indicator Overload
Problem: Chart has 10+ indicators, all saying different things
Problem: Endlessly analyzing, never pulling the trigger
Solution: Set a time limit for analysis (e.g., 5 minutes per chart). Use AI synthesis to cut through complexity.
Mistake 3: Ignoring Price Action
Problem: Relying solely on indicators, ignoring what price is actually doing
Solution: Always start with price action. Indicators are derivatives of price—price is primary.
Mistake 4: Timeframe Confusion
Problem: Bullish on 5-minute, bearish on 1-hour, confused about direction
Solution: Define your primary trading timeframe. Use higher timeframe for bias, lower for entry. Don't mix signals across timeframes.
Mistake 5: Chasing Indicators
Problem: Constantly switching to new indicators, never mastering any
Solution: Master 3-5 core indicators over years, not months. Depth beats breadth.
Backtesting Your Technical Analysis
Don't just assume patterns and indicators work—test them:
Manual Backtesting Process
Go back 6-12 months on your chart
Identify every instance of your pattern or setup
Record outcome: win or loss, profit/loss amount
Calculate win rate, average win, average loss, profit factor
Repeat for at least 50-100 setups for statistical significance
Automated Backtesting
Platforms like NinjaTrader 8 and MetaTrader 5 allow you to code your TA rules and backtest automatically:
Define entry/exit conditions precisely
Run backtest over years of data
Analyze performance metrics
Optimize parameters (but avoid overfitting)
AI Advantage: Use AI forecasting in your backtests to see if AI-confirmed setups have higher win rates than non-confirmed setups. This quantifies the AI edge.
Developing Your Technical Analysis Edge
Everyone has access to the same charts and indicators. What creates an edge?
1. Specialization
Don't try to trade every pattern on every instrument. Specialize:
Use AI not as a replacement for TA, but as a confirmation tool:
Traditional TA identifies the setup
AI forecasting confirms the probability
Together, they create higher-conviction trades
4. Continuous Learning
Markets evolve. What worked 5 years ago may work differently today:
Review your trades weekly
Identify which patterns/indicators are working best currently
Adapt your approach based on actual performance data
Conclusion: Technical Analysis in the AI Era
Technical analysis isn't dying in the age of AI—it's evolving. The traders who thrive won't be those who abandon traditional TA for AI, nor those who reject AI and stick only with classic methods. They'll be the ones who integrate both.
Think of it this way: traditional technical analysis is your foundation. It's the language you speak, the patterns you recognize, the intuition you've developed. AI forecasting is your enhancement—it's the GPS that gives you a predictive view of where the road is heading.
Master the classics: head and shoulders, flags, triangles, moving averages, MACD, RSI. But layer on AI forecasting to see where those indicators are heading before they get there. Use AI to confirm patterns, filter setups, and manage risk more effectively.
Whether you're trading on NinjaTrader 8 at your desk, monitoring from MetaTrader 5, or checking setups on your iPhone during the day, AI-powered tools like PredictIndicators.ai are now accessible across all platforms. The technology is here, it's proven, and it's ready to elevate your technical analysis.
The question isn't whether to use AI in your trading—it's whether you'll use it to enhance your existing skills or get left behind by those who do.
Master the basics. Integrate the advanced. And trade with confidence.
Trading Disclaimer: This content is for educational and informational purposes only and does not constitute financial advice, investment recommendations, or trading instructions. Trading financial instruments involves substantial risk of loss and is not suitable for all investors. Technical analysis and AI forecasting do not guarantee profits or protect against losses. Past performance of patterns or indicators is not indicative of future results. Always conduct your own research and consult with a licensed financial advisor before making any trading or investment decisions. PredictIndicators.ai is a software tool that provides predictive analytics; it does not guarantee profits or protect against losses. All trading decisions are your sole responsibility.