Technical Analysis Courses for Retail Traders in 2026: Building Chart Reading Mastery
Technical analysis remains the foundation of retail trading success. Yet most traders approach chart reading inconsistently—jumping between patterns, abandoning indicators mid-analysis, and reacting to noise rather than reading structure. The result: confusion, frustration, and missed opportunities.
If you've been searching for "technical analysis courses" or "chart reading education," you've encountered content that either oversimplifies ("Just learn support and resistance!") or overcomplicates ("Master all 50 candlestick patterns!"). The middle ground—progressive, systematic analysis education—is where real skill development happens.
In this comprehensive guide, we'll explore technical analysis courses that build skills progressively, how to integrate AI forecasting into your analytical framework without abandoning core principles, and why tools like PredictIndicators.ai are transforming how retail traders read charts across NinjaTrader 8, MetaTrader 5, iPhone, iPad, Android devices, Mac apps, and web browsers.
The Evolution of Technical Analysis Education
Technical analysis education has evolved significantly over the past decade. The "pattern memorization" approach—learn 50 candlestick patterns, memorize 20 indicator formulas—has given way to context-aware analysis that prioritizes understanding over recall.
Dynamic rule application (rules adjust to market regime)
Multi-timeframe integration
Price action AND indicators AND forecasting (layered approach)
Modern analysis doesn't discard traditional knowledge—it contextualizes it. A hammer candlestick means different things in trending vs. ranging markets. Modern education teaches that distinction.
Support and Resistance: Horizontal levels where price has reversed multiple times. These represent supply/demand imbalances. Support becomes resistance when broken (and vice versa).
Practice Exercises:
Mark structure on 100 historical charts (various instruments, timeframes)
Draw trendlines without forcing (if you need to touch 4+ points, it's wrong)
Identify broken structure (when trends reverse)
Compare structure across timeframes (daily vs. 4-hour vs. 1-hour)
MACD: Measures momentum through moving average convergence/divergence. MACD line crossing signal line = momentum shift. Histogram expansion = momentum strengthening. Divergences warn of potential reversals.
Bollinger Bands: Standard deviation bands around moving average. Price touching upper band = potentially overbought. Price touching lower band = potentially oversold. Band expansion = volatility increasing.
Mood Indicators:
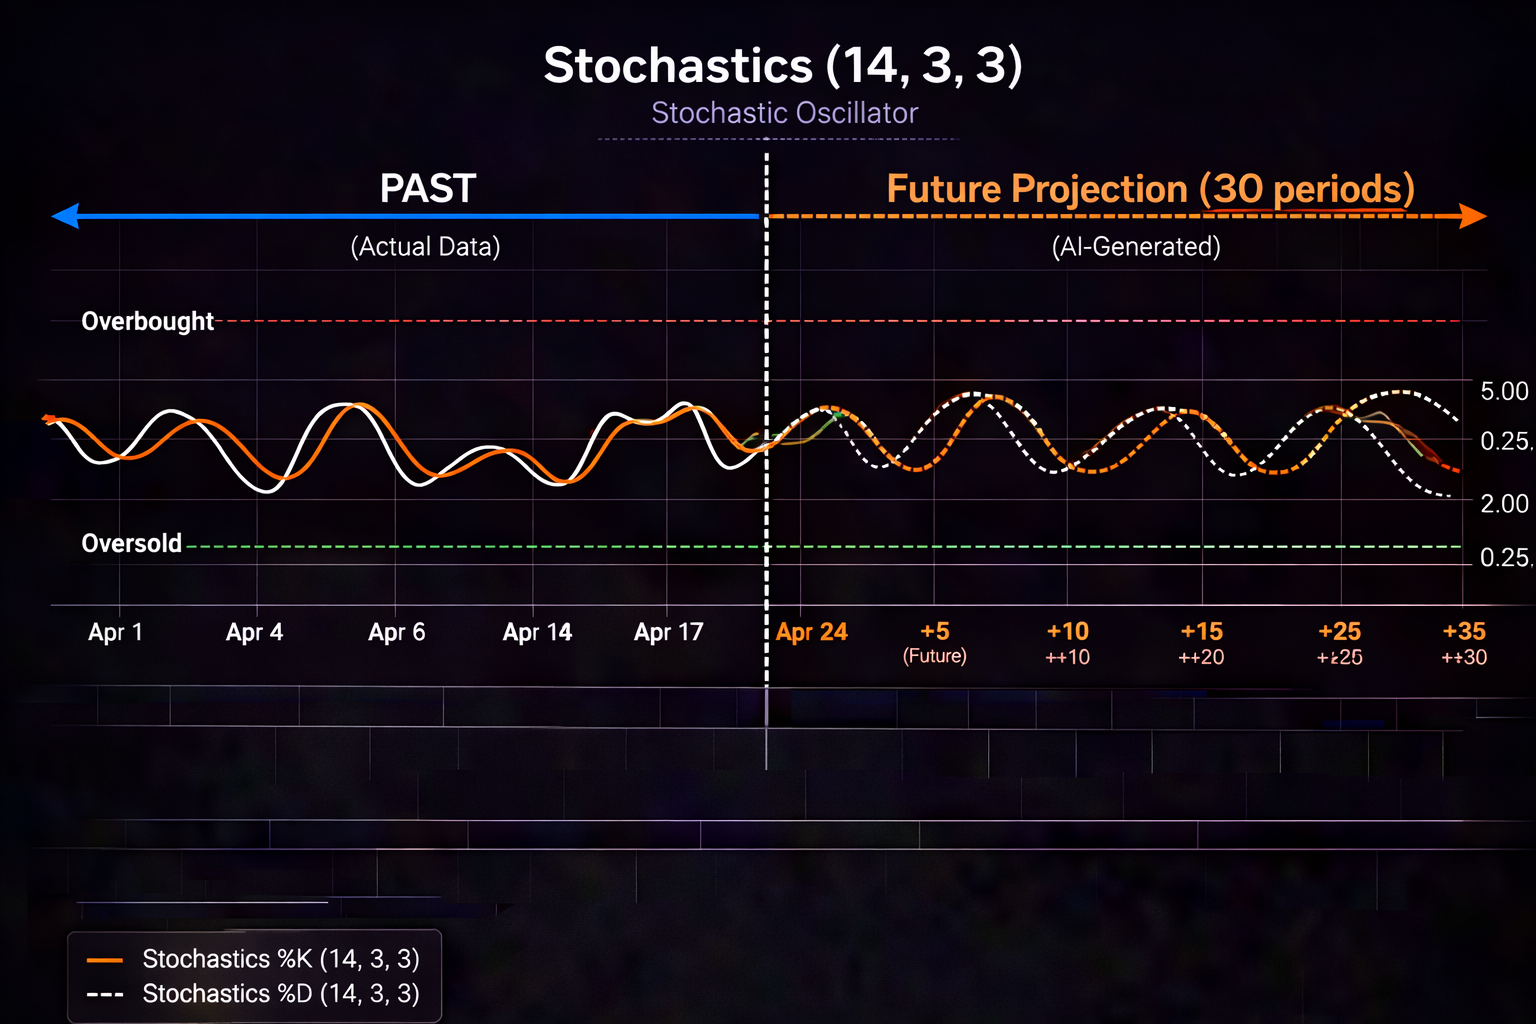
Stochastics: Identifies overbought/oversold conditions with %K and %D lines. Above 80 = overbought. Below 20 = oversold. Crossovers in extreme zones signal potential reversals.
Indicator Combination Rules:
Don't add indicators that measure the same thing (MACD + RSI both measure momentum—choose one)
Layer indicators that answer different questions (trend + momentum + volatility)
Use fewer indicators on lower timeframes (noise increases, signal clarity decreases)
Weekly Chart: Establish primary trend direction. Mark major support/resistance levels that have held for months/years.
Daily Chart: Identify intermediate trend. Note whether daily trend aligns with weekly trend (continuation) or conflicts (potential reversal developing).
4-Hour Chart: Identify developing setups. Look for patterns forming at daily support/resistance levels.
1-Hour/15-Minute Chart: Time entries precisely. Wait for trigger signals (candlestick patterns, indicator confirmations) at confluence zones.
Timeframe Alignment Scenarios:
All Timeframes Bullish: Highest conviction long setups. Weekly uptrend + daily uptrend + 4-hour bullish setup = strong long opportunity.
Higher Timeframes Bullish, Lower Bearish: Pullback in uptrend. Wait for lower timeframe to realign with higher timeframes before entering long.
Higher Timeframes Bearish, Lower Bullish: Rally in downtrend. Be cautious—counter-trend rallies often fail. Wait for confirmation or stand aside.
Timeframes in Conflict: Weekly bullish, daily bearish, 4-hour sideways = unclear bias. Reduce size or wait for clarity.
Practice Exercises:
Analyze same instrument across 4 timeframes (weekly, daily, 4-hour, 1-hour)
Note alignment vs. conflict scenarios
Track which timeframe scenarios produced best outcomes
Build preference for aligned scenarios (higher probability)
Integrating AI Forecasting into Technical Analysis
AI forecasting tools like PredictIndicators.ai add forward-looking dimensions to traditional technical analysis:
Forecasting as Pattern Confirmation
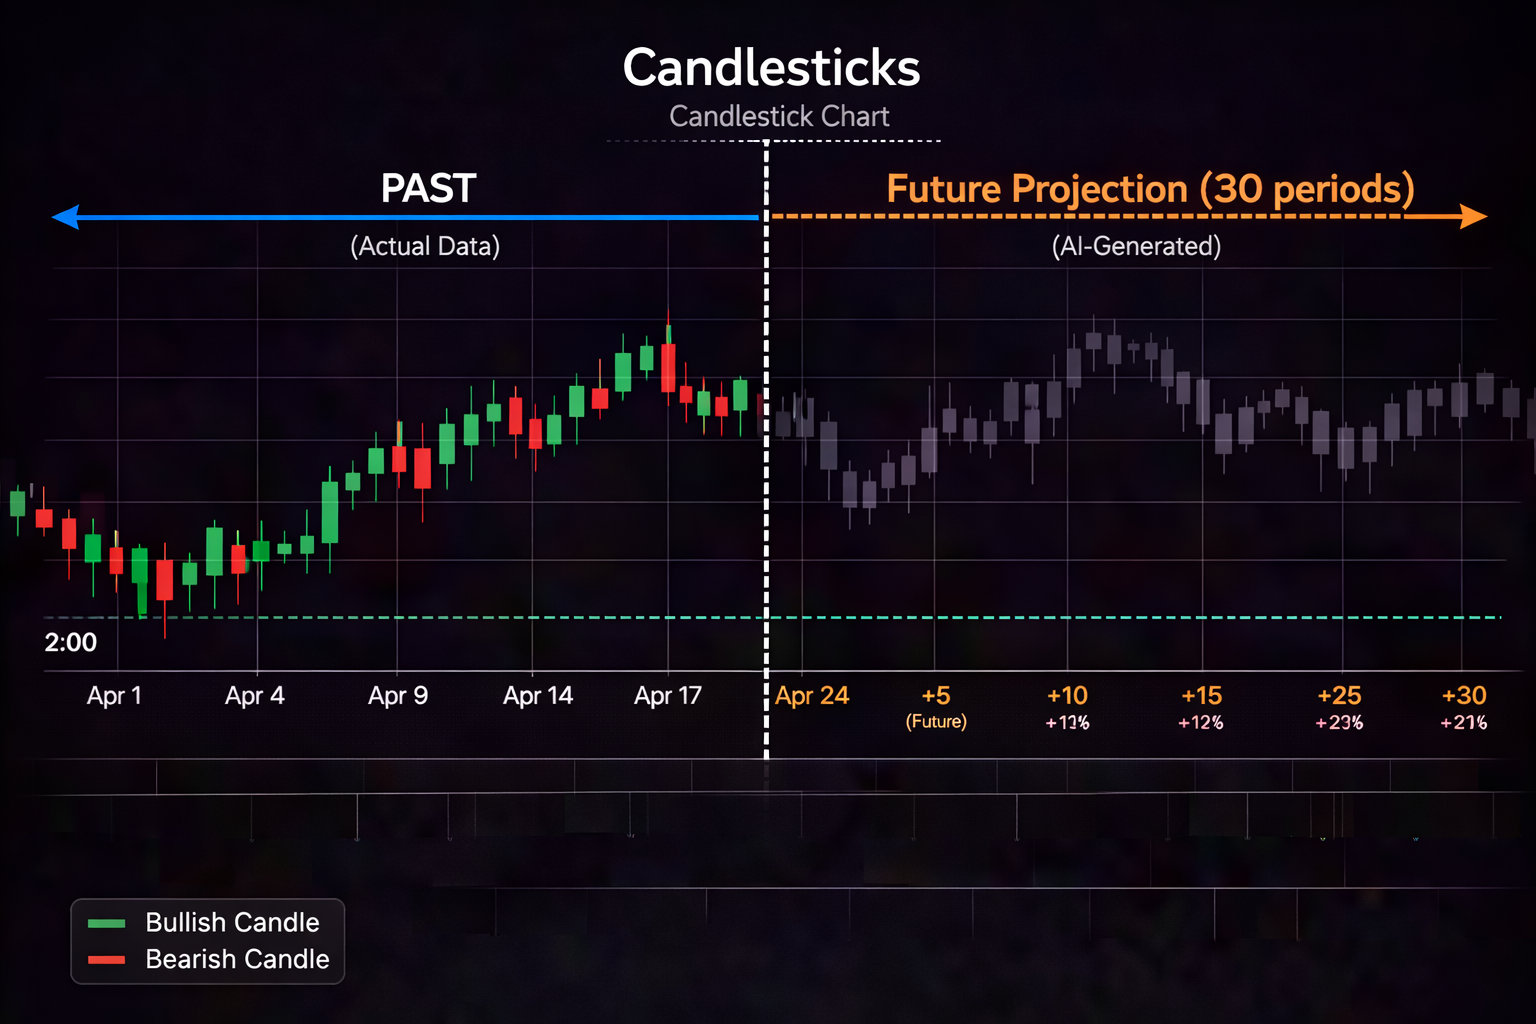
When you identify a bullish candlestick pattern at support, check AI projections. Do they show bullish continuation patterns forming 30 bars ahead? MACD bullish crossover developing? Stochastics rising from oversold? Forward-looking confirmation increases conviction.
When projections conflict with your pattern read, pause. Ask: "What am I missing?" Maybe the pattern is valid but momentum is exhausting. Maybe volatility is about to expand against your position. Projections surface what current charts don't show.
Forecasting as Indicator Context
Traditional indicators show current conditions. AI forecasting shows where those indicators might be 30 bars ahead:
Current MACD: Bullish crossover just formed
30-bar MACD projection: Shows continued histogram expansion (momentum building)
Interpretation: Bullish signal has follow-through potential, not just momentary crossover
Current Stochastics: Just crossed above 20 from oversold
30-bar Stochastics projection: Shows continued rise toward 50-70 zone (not overbought extremes)
Interpretation: Momentum recovery has room to develop, not immediate exhaustion
Interpretation: Prepare for wider stops or reduced position size as volatility expands
This forward-looking context transforms indicator reading from reactive to anticipatory.
Forecasting as Multi-Timeframe Bridge
AI forecasting bridges timeframes by showing where current lower-timeframe setups might lead on higher timeframes:
Your 4-hour chart shows bullish setup forming. 30-bar projection (which represents roughly 5-6 days on 4-hour timeframe) shows continued bullish development. This suggests the 4-hour setup could influence daily chart direction, not just create brief bounce.
This bridging helps you size positions appropriately. Brief bounces deserve smaller size than developing trend shifts. Forecasting clarifies which you're seeing.
Platform Consistency
PredictIndicators.ai's availability across NinjaTrader 8, MT5, iPhone, iPad, Android, Mac, and web ensures your forecasting-enhanced technical analysis works consistently everywhere. Your pattern recognition doesn't reset when switching from desktop to mobile. The same projection logic applies whether you're analyzing on NinjaTrader at your desk or checking setups from your iPhone during commutes.
Technical Analysis Course Formats
Different learners benefit from different course formats:
Self-Paced Video Courses
Best For: Visual learners, flexible schedules, replay capability
Structure:
Module videos (15-30 minutes each)
Chart examples walked through step-by-step
Downloadable reference guides
Quiz assessments (knowledge checks)
Lifetime access (review as needed)
Pros: Learn at your pace, replay complex topics, pause for note-taking
Cons: Requires self-discipline, no live feedback, questions may go unanswered
Live Workshop Courses
Best For: Interactive learners, real-time questions, community engagement
Structure:
Live sessions (2-3 hours, weekly or biweekly)
Real-time chart analysis demonstrations
Q&A segments (ask specific questions)
Homework assignments (apply lessons between sessions)
Community forum (peer discussion)
Pros: Live feedback, ask specific questions, learn from peer questions
Cons: Fixed schedule, may move too fast/slow for your pace, session recordings vary in quality
Mentorship Programs
Best For: Personalized learning, ongoing guidance, accountability
Structure:
One-on-one or small group sessions
Personalized curriculum (your specific challenges)
Ongoing check-ins (weekly or biweekly)
Trade review sessions (analyze your actual trades)
Long-term engagement (3-12 months typical)
Pros: Tailored to your needs, direct feedback on your trades, accountability structure
Cons: Higher cost, availability limited, quality varies significantly by mentor
Hybrid Courses (Recommended)
Best For: Balanced learning (self-paced foundation + live application)
Structure:
Self-paced video modules (core curriculum)
Monthly live Q&A sessions (clarify questions)
Community forum (peer support)
Chart review submissions (get feedback on your analysis)
Flexible timeline (complete modules at your pace)
Pros: Foundation mastery + live clarification, cost-effective, scalable
Cons: Less personalized than pure mentorship, requires self-motivation
Choosing the Right Technical Analysis Course
Your selection should reflect your learning style, experience level, and goals:
Beginner Traders (0-1 Year Experience)
Recommended: Self-paced video courses with comprehensive fundamentals
Edge refinement (what specifically works for your style)
Avoid: Generic curriculum (you need personalization), theory-heavy courses (you need practical refinement)
Technical Analysis Course Red Flags
Not all courses deliver genuine education. Watch for these warning signs:
Guaranteed Profit Claims
"Master this pattern and profit every time!" should send you running. Markets are probabilistic. No pattern, indicator, or system guarantees profits. Legitimate education acknowledges uncertainty.
Pattern Perfection Promises
"Never miss a winning setup!" ignores that patterns fail regularly. Even textbook hammer candles at perfect support levels fail sometimes. Education should teach failure recognition, not just success identification.
Indicator Overload
Courses teaching 20+ indicators simultaneously create confusion, not clarity. Quality education focuses on essential indicators (3-4 complementary tools) and teaches them deeply.
No Risk Integration
Technical analysis without risk management is incomplete. Courses that only teach "where to enter" without "where you're wrong" and "how much to risk" produce gamblers, not traders.
Platform Lock-In
Analysis education should transfer across platforms. Courses that only work with one trading platform create artificial limitations. Your chart reading skills should work on NinjaTrader 8, MT5, iPhone, iPad, Android, Mac, and web—not just one environment.
Measuring Technical Analysis Progress
Track your development with concrete metrics:
Pattern Recognition Accuracy
Review 100 historical setups where you identified patterns. Track:
How many patterns were correctly identified? (Recognition rate)
How many identified patterns led to expected outcomes? (Reliability rate)
Which patterns showed highest reliability in your trading? (Personal edge patterns)
Improvement shows as increased recognition (spotting patterns faster) and better filtering (ignoring low-quality pattern signals).
Indicator Interpretation Clarity
Review your trade journal for indicator references:
Are you using indicators as confirmation or triggers? (Confirmation is better)
Do you understand what each indicator measures? (Can you explain MACD vs. RSI differences?)
Are you avoiding indicator redundancy? (Not using 3 momentum indicators)
Improvement shows as clearer indicator language ("MACD shows momentum building" vs. "MACD looks good") and better indicator combinations.
Multi-Timeframe Consistency
Track your timeframe alignment awareness:
How often do you check higher timeframes before entering? (Should be always)
How often do you trade against higher timeframe trends? (Should be rarely)
How often do timeframe conflicts cause losses? (Should decrease over time)
Improvement shows as increased higher-timeframe checking and reduced counter-trend trading.
AI Forecasting Integration
Track your forecasting utilization:
How often do you check 30-bar projections before entering? (Build this habit)
Do projections influence your position sizing? (They should—volatility forecasts matter)
Do projections influence your stop placement? (They should—ATR forecasts inform stops)
Improvement shows as forecasting becoming natural pre-trade checklist item, not afterthought.
Final Thoughts: Technical Analysis as Lifelong Practice
Technical analysis isn't a skill you master once. It's a practice you refine continually. Markets evolve. New patterns emerge. Technology enhances traditional analysis. Your chart reading must adapt while honoring fundamentals.
PredictIndicators.ai exemplifies this evolution across all platforms—NinjaTrader 8, MT5, iPhone, iPad, Android, Mac, and web. AI forecasting doesn't replace price structure reading, candlestick pattern recognition, or indicator interpretation. It enhances them with forward-looking context that traditional technical analysis can't access.
Your analysis future isn't choosing between human pattern recognition and machine learning. It's integrating both. Price action teaches you market language. Indicators quantify momentum and volatility. AI forecasting shows where current patterns might lead. Your judgment brings them together.
That synthesis—human chart reading augmented by computational forecasting—is where modern technical analysis leads. And that's where sustainable trading careers begin.