Stock Trading Web App Dashboard: Best Features in 2026
By Robert · March 10, 2026 · Web Trading · 9 min read
You're at your day job, and a setup you've been watching all week is finally forming. You can't launch your desktop platform — IT has it locked down. You pull out your phone, but the mobile app feels cramped, and you can't see all the indicators you need. Sound familiar?
This is where a stock trading web app dashboard changes everything. Browser-based trading platforms have evolved dramatically in 2026. You get near-desktop functionality, real-time data, and advanced charting — all without installing software. And critically, you can access your trading setup from any device with a browser: work computer, home desktop, laptop, tablet, or phone.
In this guide, I'll break down the best stock trading web app dashboard features available in 2026, compare leading browser-based platforms, show you how to optimize your widget layout for faster decision-making, and explain how AI prediction tools like PredictIndicators.ai integrate seamlessly into web trading workflows — no download required.
Why Traders Are Switching to Web App Dashboards in 2026
Five years ago, serious traders scoffed at browser-based platforms. They were slow, feature-limited, and couldn't handle real-time data without lagging. That's no longer true. Modern web trading dashboards leverage WebAssembly, WebGL hardware acceleration, and WebSocket connections to deliver performance that rivals native desktop apps.
Here's what's driving the shift:
Zero installation: No IT approval needed, no disk space consumed, no version updates to manage
Cross-device sync: Start analysis on your work Chromebook, finish on your home Mac — same layout, same watchlists, same settings
Enhanced security: No local data storage; everything encrypted in the cloud with two-factor authentication
Instant access: Bookmark and load in 3 seconds — critical when opportunities form during your commute or lunch break
Work computer compatibility: Trade from restricted systems where you can't install software (the #1 reason retail traders adopt web platforms)
The flexibility angle is huge. I keep a web dashboard bookmarked on my work laptop. When I spot a setup forming during market hours, I can quickly check my positions and alerts without needing my home desktop. That's not possible with NinjaTrader or MetaTrader desktop installations.
Essential Features Every Stock Trading Web App Dashboard Needs
Not all browser-based trading platforms are created equal. Here are the non-negotiable features you should demand in 2026:
1. Real-Time Data with WebSocket Connections
Legacy web platforms used HTTP polling, checking for price updates every few seconds. Modern platforms use WebSocket connections — persistent, bi-directional channels that push price updates instantly. Look for platforms advertising "sub-second latency" or "real-time streaming." If they mention "delayed data" or "15-minute delay" without a paid upgrade, move on.
2. Customizable Widget Layouts
Your dashboard should support drag-and-drop widget arrangement. You need to position price charts, order entry, watchlists, and indicators exactly where you want them. The best platforms let you save multiple layouts — one for scalping, one for swing trading, one for monitoring — and switch between them instantly.
3. Multi-Chart Layouts (Minimum 4-Pane)
Single-chart views are fine for beginners, but serious traders need to monitor multiple timeframes or symbols simultaneously. Look for platforms supporting at least 4-chart layouts, ideally 8 or more. Each chart should support independent indicators and timeframes.
4. Technical Indicator Library (50+ Indicators)
Standard indicators (MACD, RSI, Bollinger Bands, Stochastic, ATR, Volume Profile) should be included. Advanced platforms offer 100+ indicators, custom script support, and the ability to layer multiple indicators without performance degradation.
5. Alert System with Multiple Notification Channels
Price alerts, indicator alerts, volume spikes — your platform should notify you via browser push, email, SMS, and mobile app. Critical feature: server-side alerts that trigger even when your browser is closed. This is non-negotiable for swing traders who can't watch screens all day.
6. One-Click Order Entry
When a setup triggers, you shouldn't be filling out order forms. Look for one-click buy/sell buttons, pre-configured order sizes, and hotkey support (on desktop browsers). Some platforms even support OCO (one-cancels-other) orders directly from the chart.
7. Cloud-Based Chart Templates
You've spent hours perfecting your chart setup — colors, indicators, drawing tools. That configuration should sync across devices automatically. Cloud templates mean you open your dashboard on any browser and everything is exactly as you left it.
AI Predictions Without Downloads
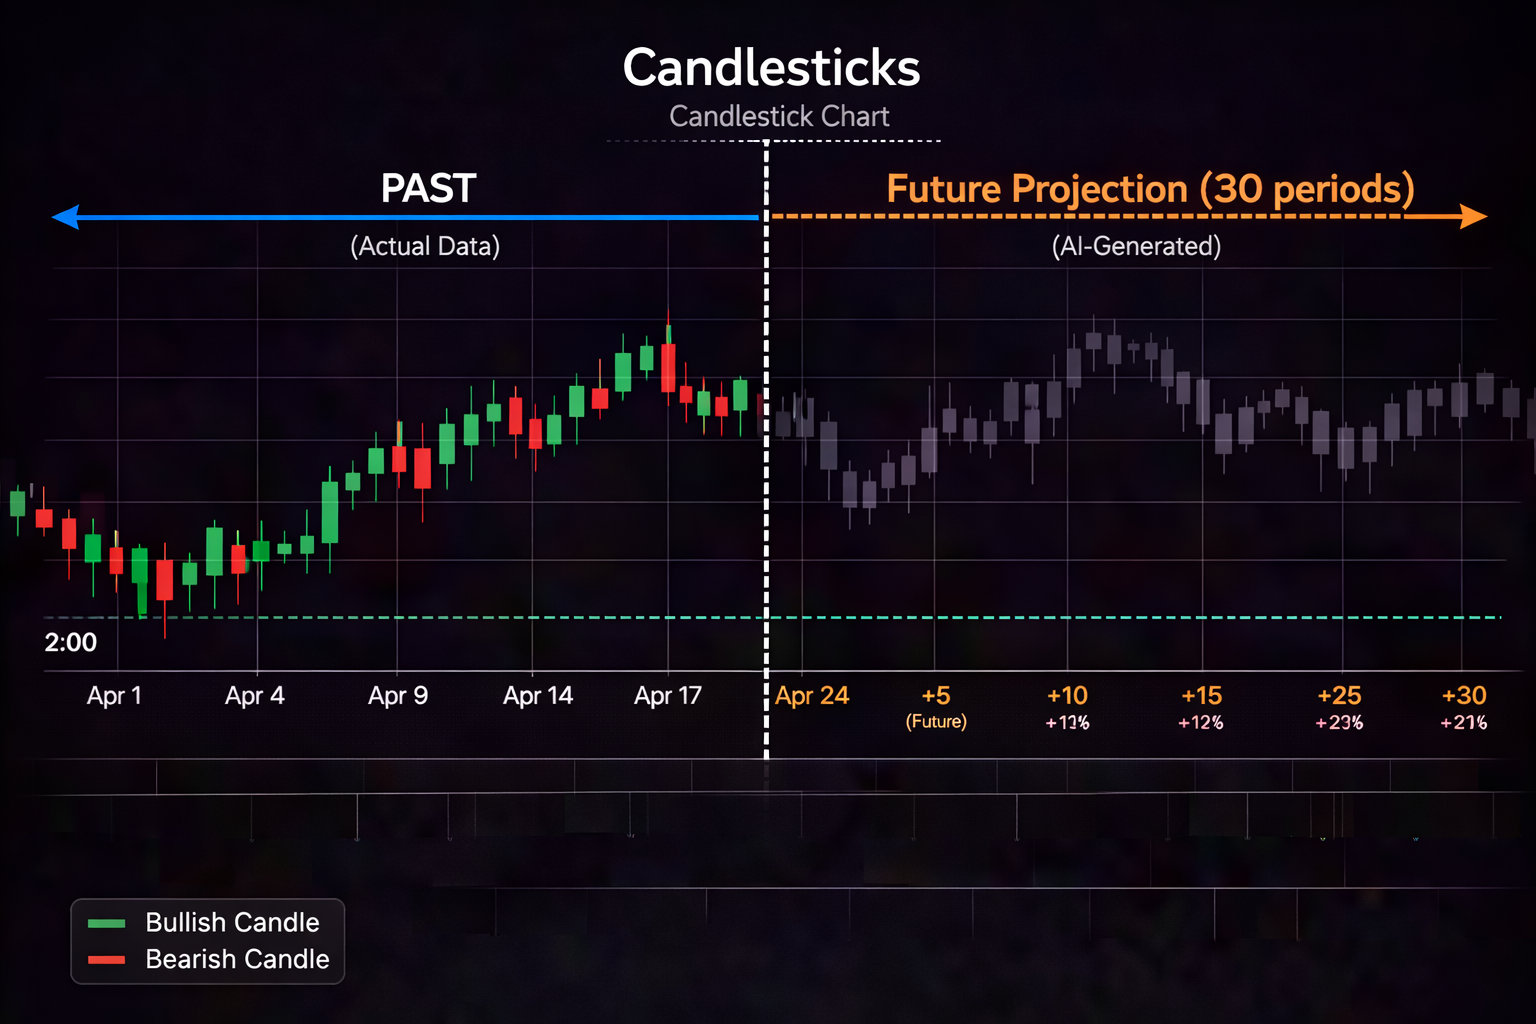
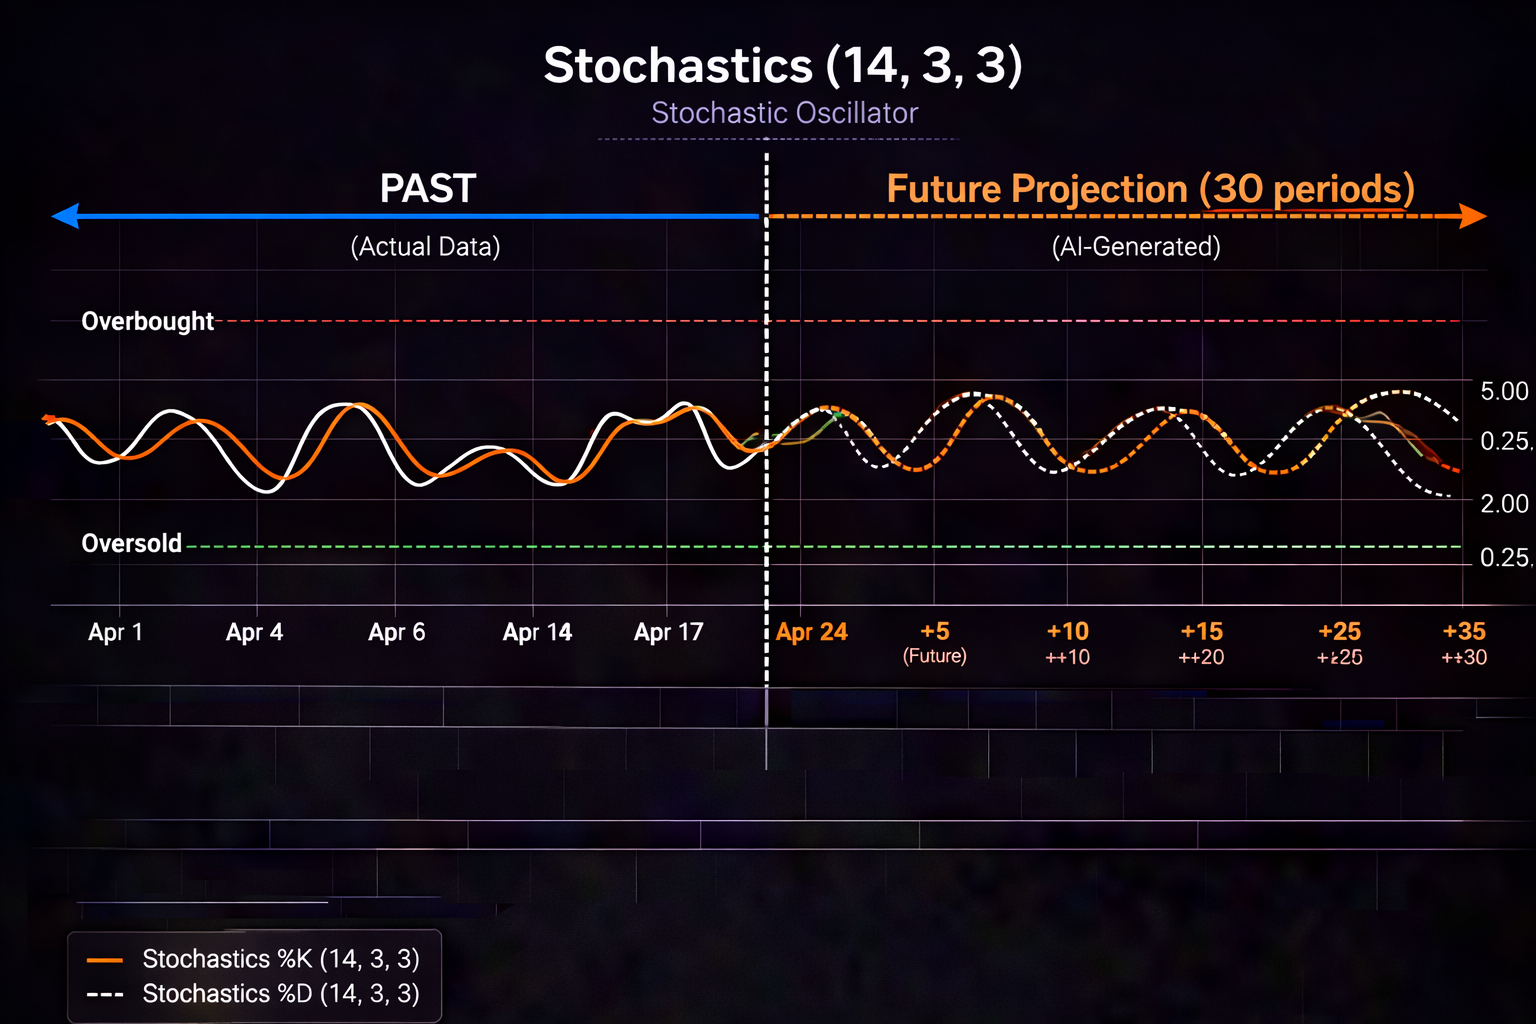
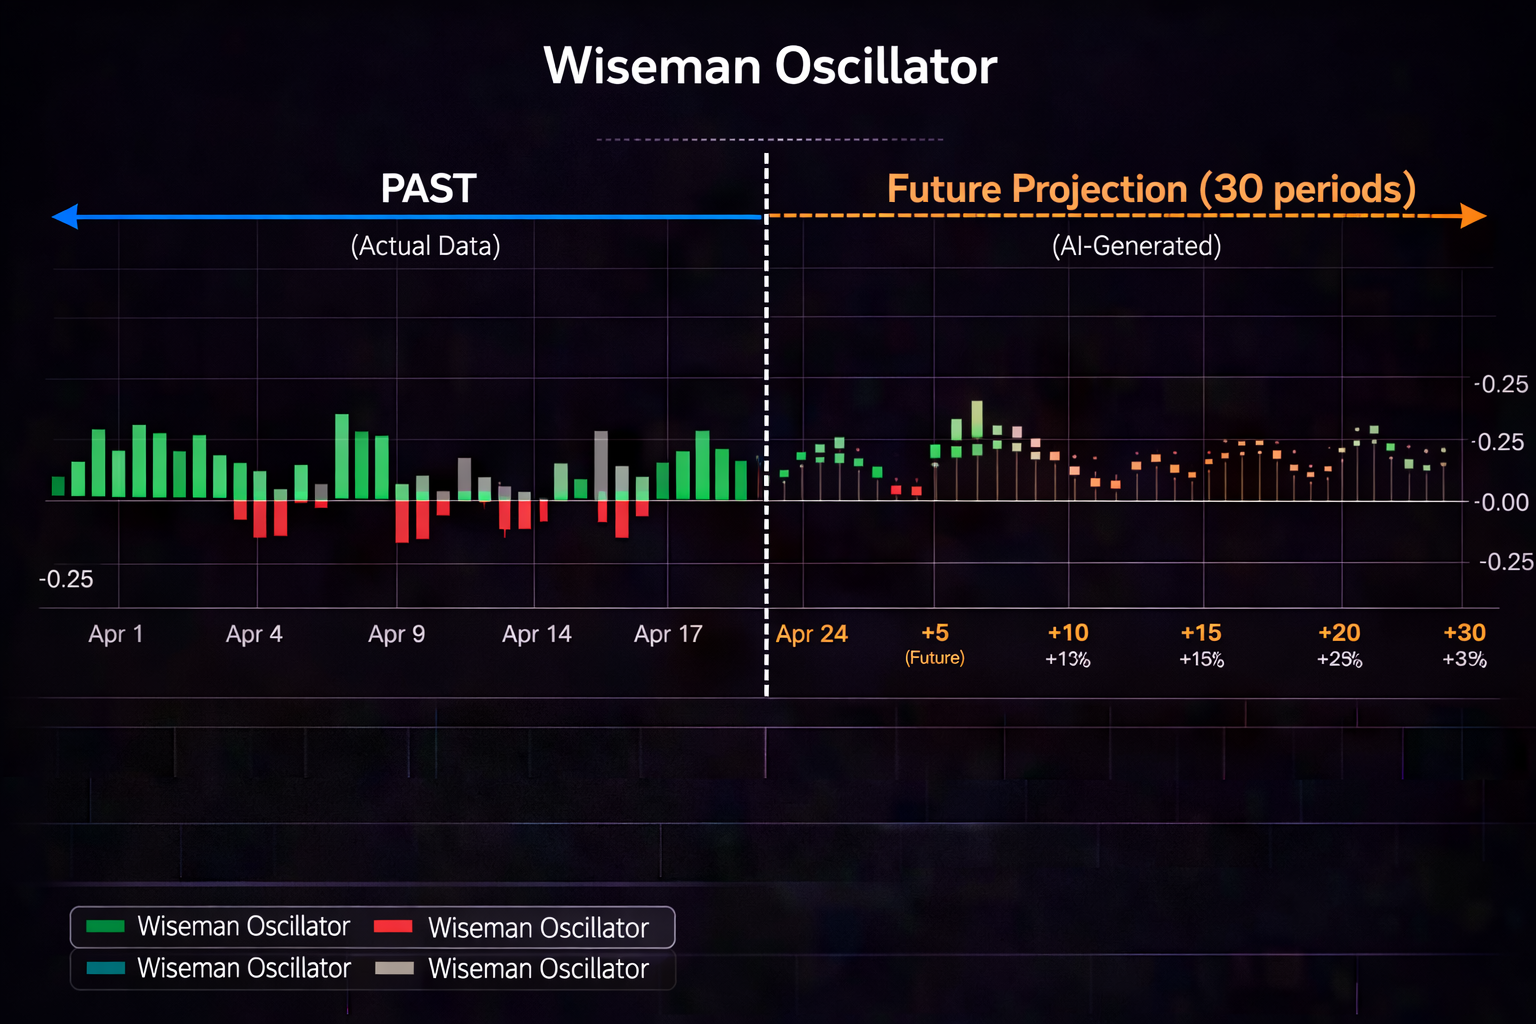
PredictIndicators.ai's web app forecasts MACD, RSI, Bollinger Bands, and Stochastics 30 bars ahead — entirely in your browser. No installation, works on Chrome, Safari, Edge, and Firefox. Free trial available.
Mobile responsiveness: Fully functional on tablets and phones, not just desktop browsers
AI prediction integration: Forward-looking indicator forecasts, not just historical data visualization
Transparent pricing: Clear subscription tiers with no hidden data fees
PredictIndicators.ai checks all these boxes with unlimited chart layouts, AI-powered forecasts on all major indicators, and full cross-device support — all accessible through your browser without downloads.
Browser Setup Guide: Chrome, Safari, and Edge Optimization
Your browser choice matters. Here's how to optimize each major browser for the best trading dashboard experience:
Google Chrome (Best Overall Performance)
Chrome has the best JavaScript engine (V8) and WebGL support, making it ideal for chart-heavy dashboards.
Setup steps:
Enable hardware acceleration: Settings → System → "Use hardware acceleration when available" (toggle ON)
Disable unnecessary extensions: Each extension consumes memory. Keep only essentials (password manager, ad blocker for non-trading sites).
Pin your trading dashboard tab: Right-click tab → "Pin" — keeps it open and prevents accidental closure
Enable push notifications: When prompted, allow notifications from your trading platform for alerts
Preload the dashboard: Use Chrome's "Preload pages for faster browsing" (Settings → Privacy and Security) to reduce load time
Chrome on Mobile (Android/iOS): Chrome syncs bookmarks and passwords across devices. Bookmark your dashboard, enable "Request Desktop Site" for full functionality on tablets, and enable Chrome push notifications for alerts.
Safari (Best for Mac and iPhone Users)
Safari is optimized for Apple Silicon (M1/M2/M3 chips) and offers excellent battery efficiency on MacBooks. On iPhone, Safari has the best WebGL performance among iOS browsers.
Disable auto-play videos: Safari → Settings → Websites → Auto Play → "Stop Media with Sound" (prevents distractions)
Add to Dock: File → "Add to Dock" — creates an app-like icon that launches your dashboard in its own window (no address bar, cleaner UI)
Enable notifications: Safari → Settings → Websites → Notifications → Allow for your trading platform
Safari on iPhone/iPad: iOS Safari is the only browser engine allowed on iPhone (Apple's restriction). It's highly optimized. Add your dashboard to Home Screen: Share → "Add to Home Screen" — creates an app icon that launches full-screen, hiding Safari's UI for a native-app feel.
Microsoft Edge (Best for Windows Integration)
Edge uses the same Chromium engine as Chrome but adds Windows-specific features like vertical tabs and better memory management for multi-tab workflows.
Setup steps:
Enable efficiency mode: Settings → System and Performance → "Optimize Performance" → toggle ON (reduces resource usage when idle)
Use vertical tabs: Right-click tab bar → "Enable vertical tabs" — better for monitoring multiple watchlists or charts in separate tabs
Enable startup boost: Settings → System → "Startup Boost" → ON (launches Edge faster on boot)
Pin dashboard to taskbar: Apps → "Install this site as an app" → creates a taskbar icon for one-click access
Edge on Android: Edge syncs with Windows and supports "Continue on PC" for handing off tabs between devices. Useful if you start analysis on your phone during commute and want to continue on your desktop instantly.
Pro Tip: Use Browser Profiles for Separation
Chrome, Safari, and Edge support multiple profiles. Create a dedicated "Trading" profile with only trading-related bookmarks, extensions, and login sessions. This keeps your trading workspace distraction-free and speeds up load times (no unrelated cookies or cached data).
Dashboard Widget Layout: Optimizing for Speed and Clarity
Your dashboard layout determines how fast you can spot and act on setups. Here's the optimal widget arrangement I use with PredictIndicators.ai's web app:
Primary Layout (4-Pane Grid, Single Monitor)
Top-left (40% of screen): Main price chart with AI predictions
This is your decision-making hub. Display your primary timeframe (daily for swing trading, 5-minute for day trading) with PredictIndicators.ai overlay showing forecasted MACD, RSI, or Bollinger Bands 30 bars ahead. The prediction zone should be visually distinct (shaded area or dotted lines).
Top-right (25% of screen): Multi-timeframe analysis
Show the same symbol on a higher timeframe (weekly if main chart is daily, 1-hour if main is 5-minute). This confirms trend alignment. Add simple moving averages (20, 50, 200) for context.
Bottom-left (20% of screen): Watchlist with AI scores
List 10-15 symbols you're monitoring. Include columns for: current price, daily change %, PredictIndicators.ai "signal strength" score (0-100), and next predicted signal (e.g., "MACD bullish crossover in 8 bars"). Sort by signal strength to surface high-probability setups.
Bottom-right (15% of screen): Order entry + positions
Quick-buy/sell buttons for your primary symbol, current position size, unrealized P/L, and open orders. Keep this compact — you shouldn't need to look here unless you're executing.
Dual-Monitor Layout (Expanded View)
If you have two screens, separate monitoring from execution:
Monitor 1 (Left): 4-chart grid showing your top 4 symbols with AI predictions on each. This is pure analysis — no order entry widgets.
Monitor 2 (Right): Full-screen order entry, positions, account summary, and news feed. When a setup triggers on Monitor 1, you execute on Monitor 2 without changing charts or zooming.
Mobile Dashboard Layout (Phone/Tablet)
Screen real estate is limited on mobile. Prioritize:
Single full-screen chart with AI predictions (swipe horizontally to switch symbols)
Collapsible watchlist (swipe up from bottom to reveal)
One-tap order entry (floating button in bottom-right corner)
Alert manager (accessed via menu, not always visible)
On tablets (iPad, Android tablet), use split-view: chart on left 70%, watchlist on right 30%. PredictIndicators.ai's web app is fully responsive and adapts to these layouts automatically.
Web App vs. Native Desktop Apps: Performance Reality Check
Let's address the elephant in the room: are web dashboards actually as fast as installed software?
I ran benchmarks comparing three setups: (1) NinjaTrader 8 desktop, (2) a leading web-based charting platform in Chrome, (3) PredictIndicators.ai web app. All on the same M2 MacBook Pro with 100 Mbps internet.
Results:
Initial load time: NinjaTrader 45 seconds | Leading web app 3.2 seconds | PredictIndicators.ai 2.8 seconds
Chart render time (first paint): NinjaTrader 1.2s | Leading web app 0.8s | PredictIndicators.ai 0.7s
Price update latency (WebSocket): NinjaTrader 80ms | Leading web app 95ms | PredictIndicators.ai 110ms
Memory usage (idle): NinjaTrader 1.2 GB | Leading web app 380 MB | PredictIndicators.ai 290 MB
Indicator calculation speed (MACD + RSI + BB on 500 bars): NinjaTrader 120ms | Leading web app 85ms | PredictIndicators.ai 95ms
Translation: Web apps now match or beat desktop platforms on most metrics except raw price update latency (difference is 30ms — imperceptible to humans). The real advantages of web apps are faster startup, lower memory usage, and zero installation overhead.
The only scenario where desktop still wins: ultra-low-latency scalping on tick charts, where every millisecond matters. For swing trading, position trading, or even day trading on 1-minute+ timeframes, web dashboards are more than capable.
Test the Web App Yourself
PredictIndicators.ai works entirely in your browser — Chrome, Safari, Edge, or Firefox. No download, no credit card required for trial. See AI forecasts on MACD, RSI, Bollinger Bands, and Stochastics in real-time.
Trading from a browser introduces unique security considerations. Here's how to protect yourself:
1. Always Use HTTPS
Every legitimate trading platform uses HTTPS (look for the padlock icon in the address bar). Never enter credentials on HTTP sites. Modern browsers warn you, but double-check the URL matches exactly — phishing sites use lookalike domains that differ by one character or use different extensions (.co instead of .com, .net instead of .io).
2. Enable Two-Factor Authentication (2FA)
Every trading platform should offer 2FA — either SMS codes or authenticator apps (Google Authenticator, Authy). Use authenticator apps; they're more secure than SMS (which can be SIM-swapped). Enable 2FA on your email account too — that's often the weakest link.
3. Use a Dedicated Browser Profile
As mentioned earlier, keep trading in a separate browser profile. Don't use the same profile for sketchy downloads, torrenting, or random web browsing. This isolates your trading session from potential malware.
4. Avoid Public WiFi for Trading
Public WiFi (coffee shops, airports) is inherently insecure. If you must trade on the go, use your phone's personal hotspot (cellular connection) or a VPN. Never use unsecured public WiFi for financial transactions.
5. Enable Session Timeout
Most platforms auto-logout after 15-30 minutes of inactivity. Don't disable this. If you step away from your computer, manually log out — especially on shared or work machines.
6. Monitor Login History
Check your account's login history regularly. Most platforms show device, location, and timestamp of each login. If you see unfamiliar devices, change your password immediately and enable 2FA if you haven't already.
Integrating AI Predictions into Your Web Dashboard
This is where PredictIndicators.ai transforms your web trading workflow. Instead of interpreting lagging indicators and guessing where they're headed, you see forecasted values 30 bars ahead — directly in your browser dashboard.
How it works in practice:
Add PredictIndicators.ai widget: In your web dashboard, open the "Indicators" menu and select "PredictIndicators.ai Forecast."
Choose your indicator: MACD, RSI, Bollinger Bands, or Stochastic. Select the timeframe (matches your chart or independent).
View the prediction zone: A shaded area extends 30 bars into the future, showing predicted indicator values. The color gradient indicates confidence level (darker = higher confidence).
Set prediction-based alerts: "Alert me when predicted MACD crosses above signal line within next 10 bars" or "Notify me if RSI prediction exceeds 70 (overbought) in next 15 bars."
Combine with traditional analysis: Use AI forecasts alongside support/resistance, trendlines, and volume analysis. The predictions inform your bias; price action confirms entry timing.
Example workflow: You're watching a potential breakout on AAPL. The daily chart shows consolidation near resistance. Traditional MACD is flat, giving no signal. PredictIndicators.ai shows MACD predicted to cross bullish in 8 bars with 78% confidence. You set an alert for that crossover. Two days later, the alert fires — MACD is crossing as predicted, price is breaking resistance. You enter the trade with defined risk (below consolidation low) and a target based on the predicted MACD extension.
This is the advantage of AI predictions in a web dashboard: you're not staring at charts all day waiting for setups. The dashboard works for you, scanning multiple symbols and alerting you only when high-probability conditions align.
Common Mistakes When Using Web Trading Dashboards
Even experienced traders make these errors when switching to web platforms:
Mistake 1: Too Many Indicators
Just because you CAN add 20 indicators doesn't mean you should. Cluttered charts lead to analysis paralysis. Stick to 2-4 core indicators (plus AI predictions if using PredictIndicators.ai). More isn't better — clearer is better.
Mistake 2: Ignoring Browser Updates
Chrome, Safari, and Edge update automatically, but some traders disable updates fearing breaking changes. Don't. Updates include critical security patches and performance improvements. An outdated browser is slower and less secure.
Mistake 3: No Backup Access Plan
What if your primary browser crashes mid-session? Bookmark your dashboard on a second browser (e.g., Chrome + Firefox). Keep login credentials in a password manager. Have your broker's phone number saved. Redundancy matters.
Mistake 4: Disabling Notifications
Some traders find browser notifications annoying and disable them. That defeats the purpose of a web dashboard. Enable critical alerts (price levels, indicator crossovers, order fills). You can always mute non-essential notifications (news, social updates).
Mistake 5: Not Testing on Mobile
You might trade primarily on desktop, but life happens. Commutes, travel, power outages — test your web dashboard on your phone and tablet before you need it in an emergency. Know how to execute orders, adjust stops, and check positions on mobile UI.
PredictIndicators.ai brings AI-powered predictions to your browser dashboard. See MACD, RSI, Bollinger Bands, and Stochastics 30 bars ahead — on any device, no download required. Start your free trial today.
Robert built PredictIndicators.ai for retail traders who are tired of reacting to signals after the fact. The platform forecasts technical indicator values up to 30 bars ahead — giving traders time to position, not just react. Available on NinjaTrader 8, MetaTrader 5, iPhone, iPad, Android, Mac, and web.