NinjaTrader 8 DMA Settings for Day Trading: Optimal Parameters & Configurations
By Robert — Founder, PredictIndicators.ai



If you're day trading on NinjaTrader 8, the Day Moving Average (DMA) is one of the most powerful tools in your arsenal. But here's the truth: most traders use default settings that weren't built for their specific style, timeframe, or market conditions. Getting your DMA settings right can mean the difference between catching a strong intraday trend early or watching it pass you by.
In this guide, I'll walk you through the optimal DMA configurations for day trading on NinjaTrader 8, share real-world performance examples, and show you how to layer prediction technology on top of your DMA setup to stay ahead of the curve.
What Is the Day Moving Average (DMA)?
The Day Moving Average is a simple but powerful indicator that calculates the average price of an asset over a specific number of bars within the current trading session. Unlike traditional moving averages that span days or weeks, the DMA resets at the start of each trading day, making it ideal for intraday traders who need to gauge momentum and trend direction in real-time.
On NinjaTrader 8, the DMA helps you:
- Identify the prevailing intraday trend
- Spot potential support and resistance levels
- Time your entries and exits more precisely
- Filter out noise in choppy market conditions
Optimal DMA Settings for Day Trading on NinjaTrader 8
There's no one-size-fits-all answer, but after working with hundreds of retail traders, I've seen certain parameter ranges consistently outperform others. The "best" DMA setting depends on your trading style, the instrument you're trading, and your preferred timeframe.
1. Short-Term DMA (Scalping & Quick Entries)
Recommended Period: 8-13 bars
This fast-moving average is ideal for scalpers or traders looking to catch quick momentum shifts. On a 1-minute or 2-minute chart, an 8-period DMA will hug price closely and give you early signals when momentum is building. Use this when trading volatile instruments like /ES (S&P 500 futures) or /NQ (Nasdaq futures) during the first two hours of the session.
2. Medium-Term DMA (Swing Intraday Trades)
Recommended Period: 20-34 bars
This is the sweet spot for most day traders. A 20-period DMA on a 5-minute chart gives you a clear picture of the session's trend without excessive noise. It's responsive enough to catch meaningful moves but smooth enough to filter out false breakouts. I recommend starting with 20 bars on 5-minute charts and adjusting based on your instrument's volatility.
3. Long-Term DMA (Trend Confirmation & Filter)
Recommended Period: 50-89 bars
Use this as a trend filter rather than an entry trigger. When price is above the 50-period DMA, look for long setups. When below, focus on shorts. This is especially useful on 15-minute charts for traders who prefer fewer, higher-quality trades per session.
How to Add and Configure DMA on NinjaTrader 8
- Open your Chart: Load the instrument you want to trade (e.g., /ES, /NQ, /CL)
- Right-click on the Chart: Select Indicators
- Search for "Moving Average": NinjaTrader 8 has multiple MA types — select Simple for DMA
- Set Parameters:
- Period: Enter your chosen value (8, 20, 50, etc.)
- Input Type: Select Close (most common) or Typical (HL-C average)
- Session Template: Ensure Synthetic or ETH is selected if you want the DMA to reset at session start
- Apply and Save: Click OK, then save your workspace for future sessions
Performance Examples: DMA in Action
Let me share a couple of real setups where DMA settings made the difference.
Example 1: /ES Morning Breakout (20-period DMA on 5-min)
On a typical trending morning, /ES broke above the overnight high at 9:45 AM ET. Price pulled back to the 20-period DMA at 10:02 AM, held the level, and resumed higher. Traders who watched the DMA got a clean long entry with a stop just below the average. The move ran 8 ticks before hitting the next resistance.
Example 2: /NQ Reversal Signal (50-period DMA on 15-min)
/NQ had rallied for three consecutive 15-minute bars. At 11:30 AM, price extended far above the 50-period DMA (a sign of overbought conditions). When price crossed back below the 50 DMA on heavy volume, it signaled a potential reversal. Short entries from that level captured a 25-point move into the lunch hour.
Common DMA Mistakes Retail Traders Make
- Using the same period on all timeframes: A 20-period DMA on a 1-minute chart is NOT the same as on a 15-minute chart. Adjust your period based on how much price action you want to smooth.
- Ignoring session resets: If your DMA doesn't reset at the session open, you're mixing overnight data with day data — that defeats the purpose of a Day Moving Average.
- Chasing price away from the DMA: The best risk/reward entries happen near the DMA, not when price is extended far from it.
- Using DMA alone without confirmation: Always pair your DMA with volume, price action, or momentum signals for higher-probability setups.
Layering PredictIndicators.ai on Top of Your DMA Setup
Here's where things get interesting. The DMA tells you where price has been on average — but what if you knew where your indicators and price action were heading over the next 30 bars?
That's exactly what PredictIndicators.ai does. It's available on all 8 platforms (NinjaTrader 8, MetaTrader 5, iPhone, iPad, Android phone, Android tablet, Mac app, and Web app), and it integrates seamlessly with your existing DMA setup.
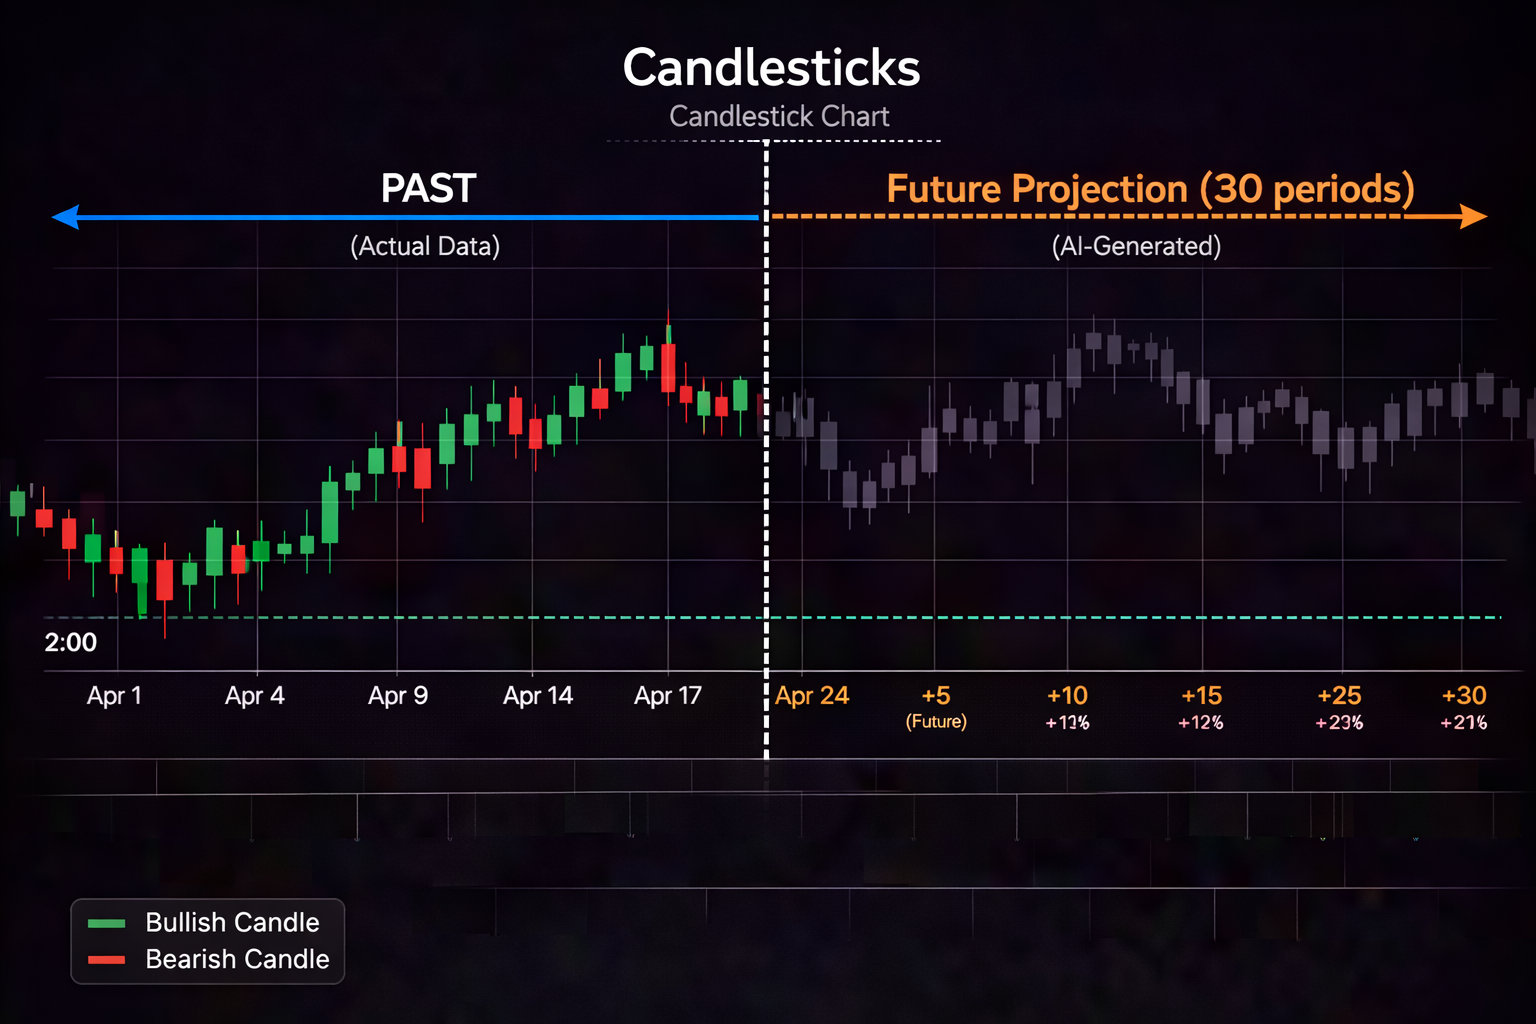
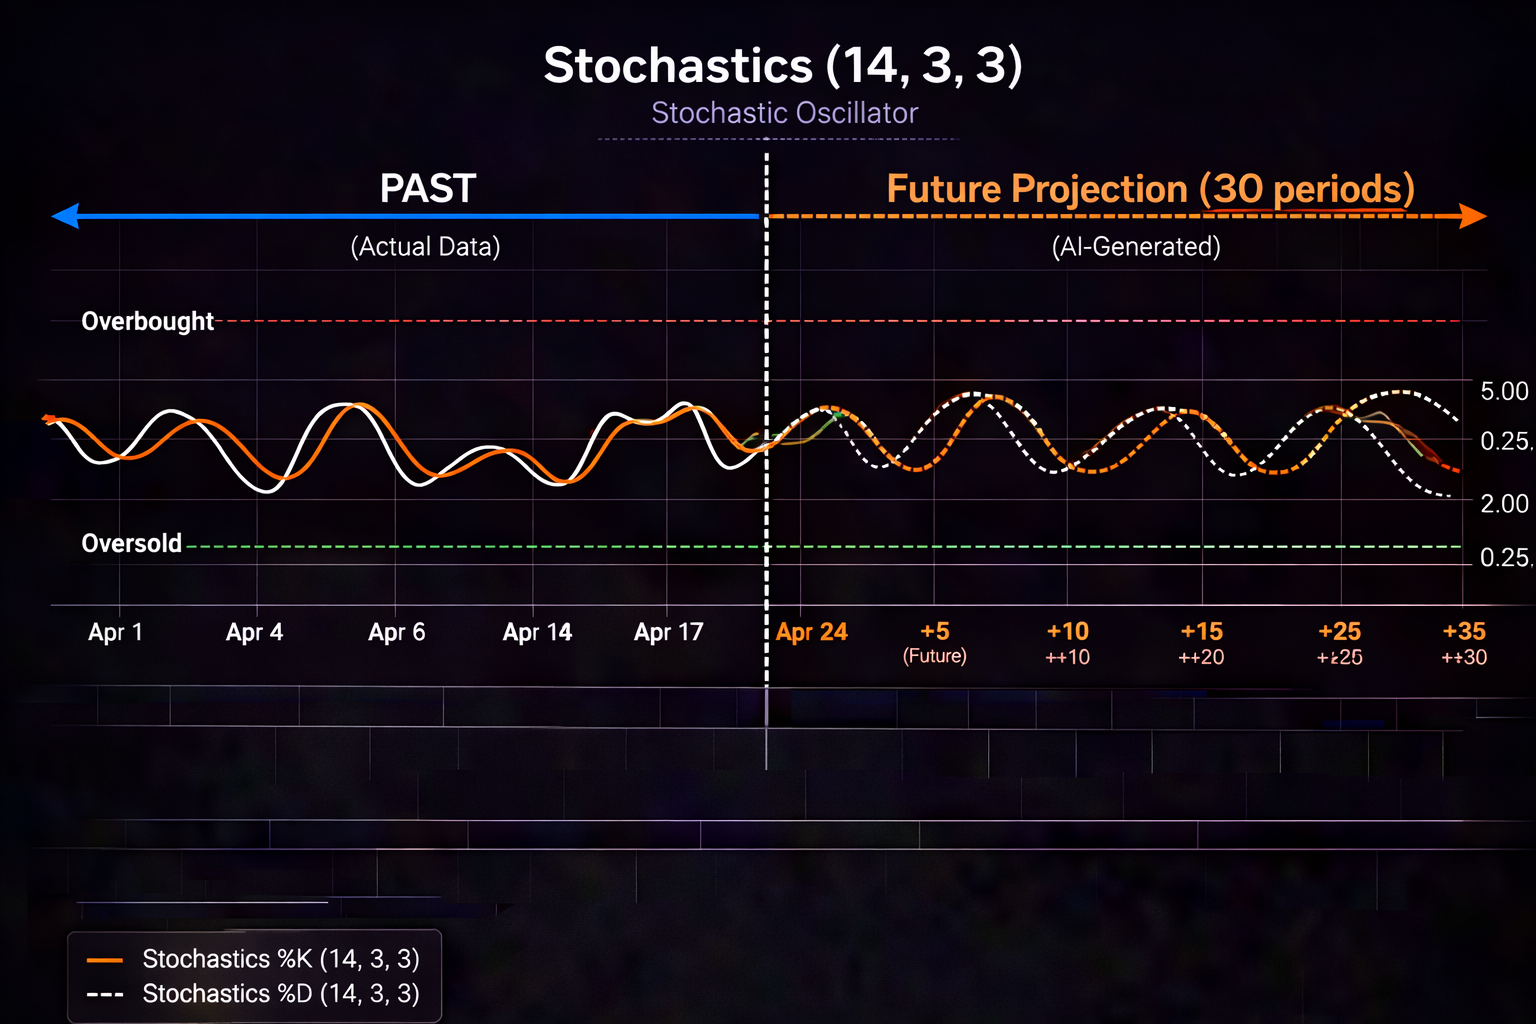
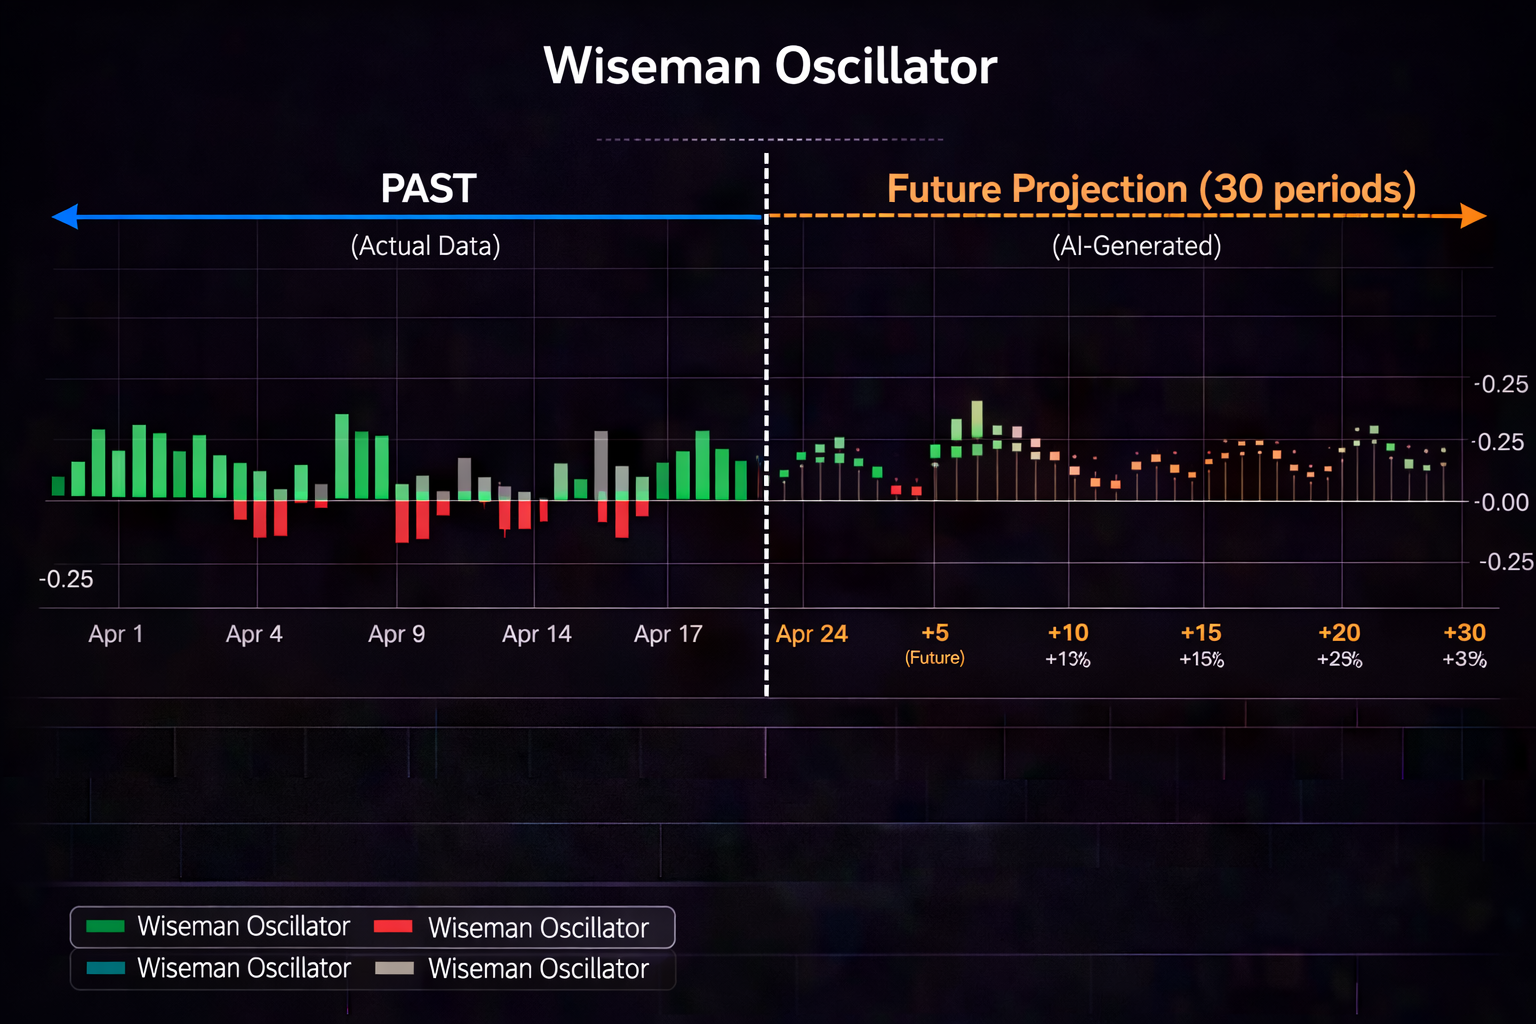
Imagine this: you're watching a pullback to your 20-period DMA on /ES. Price is hovering around the average, and you're wondering if this is a legitimate support level or if the trend is about to break. PredictIndicators.ai projects your MACD, Stochastics, ATR, and candlestick patterns 30 bars into the future, giving you a forward-looking view of whether momentum is likely to continue or reverse.
See It in Action
Check out live prediction examples and see how forecasts align with your DMA setups. Get started free at predictindicators.ai.
DMA Prediction Example: Using Forecasts to Confirm Setups
Let's walk through a scenario where prediction technology complements your DMA reading:
- Setup: Price pulls back to the 20-period DMA on a 5-minute /NQ chart
- DMA Signal: Price touches the DMA and forms a bullish engulfing candle
- Prediction Layer: PredictIndicators.ai forecasts show MACD turning bullish over the next 15 bars, with Stochastics exiting oversold territory
- Decision: The DMA gave you the entry level; the prediction gave you confidence that momentum would follow through
- Result: Entry at the DMA bounce, target hit 12 bars later as predicted
Trading Strategies Built Around DMA
Strategy 1: DMA Bounce Play
Conditions:
- Price is trending above (long) or below (short) the 20-period DMA
- Price pulls back to touch or slightly pierce the DMA
- Volume declines on the pullback (shows lack of conviction)
- Entry on first bar that closes back in the trend direction
- Stop: 2-3 ticks below/above the DMA extreme
- Target: Previous swing high/low or 1.5x risk
Strategy 2: DMA Cross Reversal
Conditions:
- Price has been extended far from the 50-period DMA (overbought/oversold)
- Price crosses decisively through the 50 DMA with above-average volume
- Entry on retest of the DMA from the other side
- Stop: Beyond the extreme of the cross bar
- Target: Opposite side of the day's range or 2x risk
Strategy 3: Dual-DMA Crossover
Setup: Plot both a 20-period and 50-period DMA on your chart.
- Go long when the 20 DMA crosses above the 50 DMA (bullish momentum shift)
- Go short when the 20 DMA crosses below the 50 DMA (bearish momentum shift)
- Wait for the crossover bar to close before entering
- Stop: Below the most recent swing low/high
- This works best on 5-minute or 15-minute charts during trending sessions
Fine-Tuning Your DMA Settings
Start with the recommended ranges above, then track your results over 20-30 trading sessions. Ask yourself:
- Is my DMA too sensitive (giving false signals)? → Increase the period
- Is my DMA too slow (missing early entries)? → Decrease the period
- Am I getting whipsawed in choppy markets? → Add a second, slower DMA as a filter
- Am I missing moves in strong trends? → Drop to a faster timeframe or shorten the period
Keep a trading journal noting the DMA period, timeframe, instrument, and outcome for each setup. Patterns will emerge quickly, and you'll dial in your optimal settings faster than you think.
Final Thoughts
The Day Moving Average is a timeless tool for day traders, but its power comes from how you configure and apply it. There's no magic number — the best DMA setting is the one that fits your trading style, your instruments, and your risk tolerance.
Start with the ranges I've shared: 8-13 for scalping, 20-34 for standard day trades, 50-89 for trend filtering. Test them in simulation, track your results, and adjust from there. And remember: the DMA shows you where price has been — layering tools like PredictIndicators.ai shows you where it's likely going.
Whether you're trading on NinjaTrader 8, MetaTrader 5, or any of the mobile and web platforms, the principles remain the same. Master your DMA settings, respect your risk rules, and let the edge compound over time.