Market Analysis Tutorials for Retail Traders in 2026: From Basics to Advanced Integration
Market analysis remains the cornerstone of trading success. Yet most retail traders approach analysis inconsistently—jumping between indicators, abandoning frameworks mid-trade, and reacting to noise rather than reading structure. The result: confusion, frustration, and account erosion.
If you've been searching for "market analysis tutorials" or "technical analysis for retail traders," you've encountered content that either oversimplifies ("Just follow the 200 MA!") or overcomplicates ("Master harmonic patterns and Fibonacci confluence!"). The middle ground—systematic, progressive analysis education—is where real improvement happens.
In this comprehensive guide, we'll walk through market analysis tutorials that build skills progressively, how to integrate AI forecasting into your analytical framework without abandoning core principles, and why tools like PredictIndicators.ai are transforming how retail traders read markets across NinjaTrader 8, MetaTrader 5, iPhone, iPad, Android devices, Mac apps, and web browsers.
Progressive Market Analysis Education
Effective analysis education builds skills layer by layer. Each layer rests on the previous one. Skipping layers creates fragility—traders who use advanced tools without foundational understanding crack under pressure.
Layer 1: Price Action Fundamentals
Before adding indicators, master reading price itself:
Support and Resistance: Identify horizontal levels where price has reversed multiple times. These represent supply/demand imbalances. Mark them clearly on your charts. Watch how price reacts when approaching these levels.
Trend Identification: Higher highs and higher lows define uptrends. Lower highs and lower lows define downterans. Sideways movement defines ranges. Trends persist until structure breaks. Don't fight established trends without clear reversal signals.
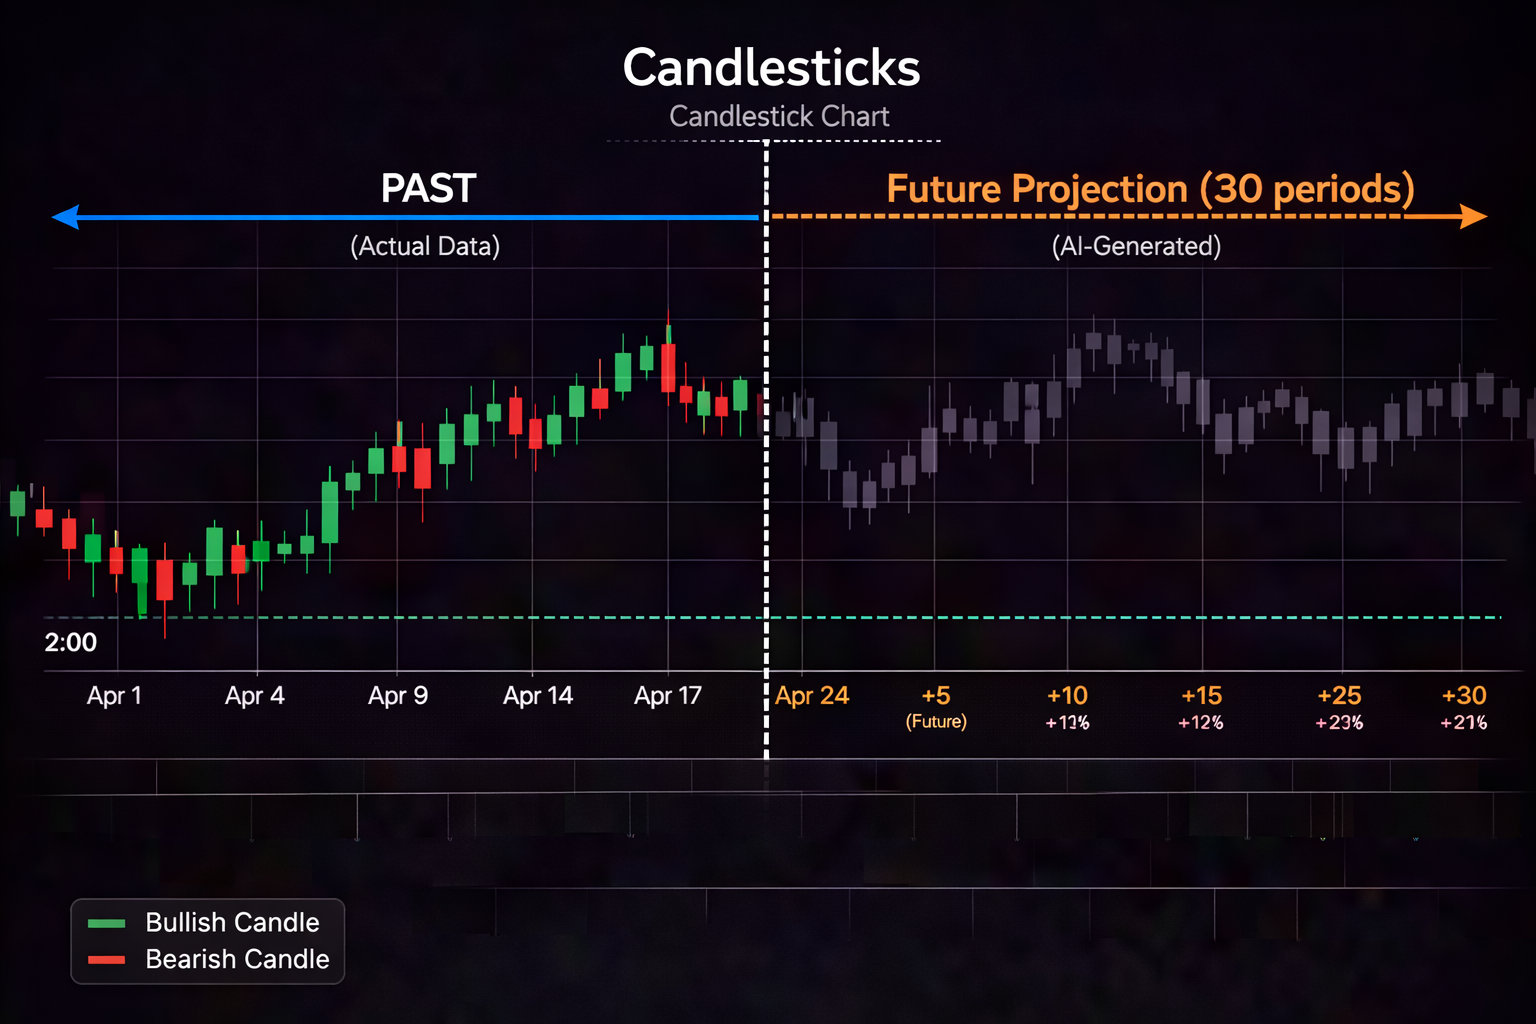
Candlestick Patterns: Learn key reversal and continuation patterns: engulfing bars, hammers, shooting stars, inside bars, outside bars. These signals gain significance at support/resistance levels or trend extremes.
Volume Confirmation: Price moves on high volume carry more conviction than low-volume moves. Volume expansion on breakouts suggests genuine interest. Volume contraction on pullbacks suggests temporary pauses.
Master this layer before adding complexity. Price action never becomes obsolete. Indicators derive from price—they're secondary, not primary.
Layer 2: Core Indicators
Add indicators that complement price reading, not replace it:
Moving Averages: 20-period (short-term trend), 50-period (intermediate trend), 200-period (long-term trend). Price above/below MAs establishes trend bias. MA crossovers signal momentum shifts. MAs act as dynamic support/resistance.
MACD: Measures momentum through moving average convergence/divergence. MACD line crossing signal line suggests momentum shifts. Histogram expansion/contraction shows momentum strength/weakness. Divergences between MACD and price warn of potential reversals.
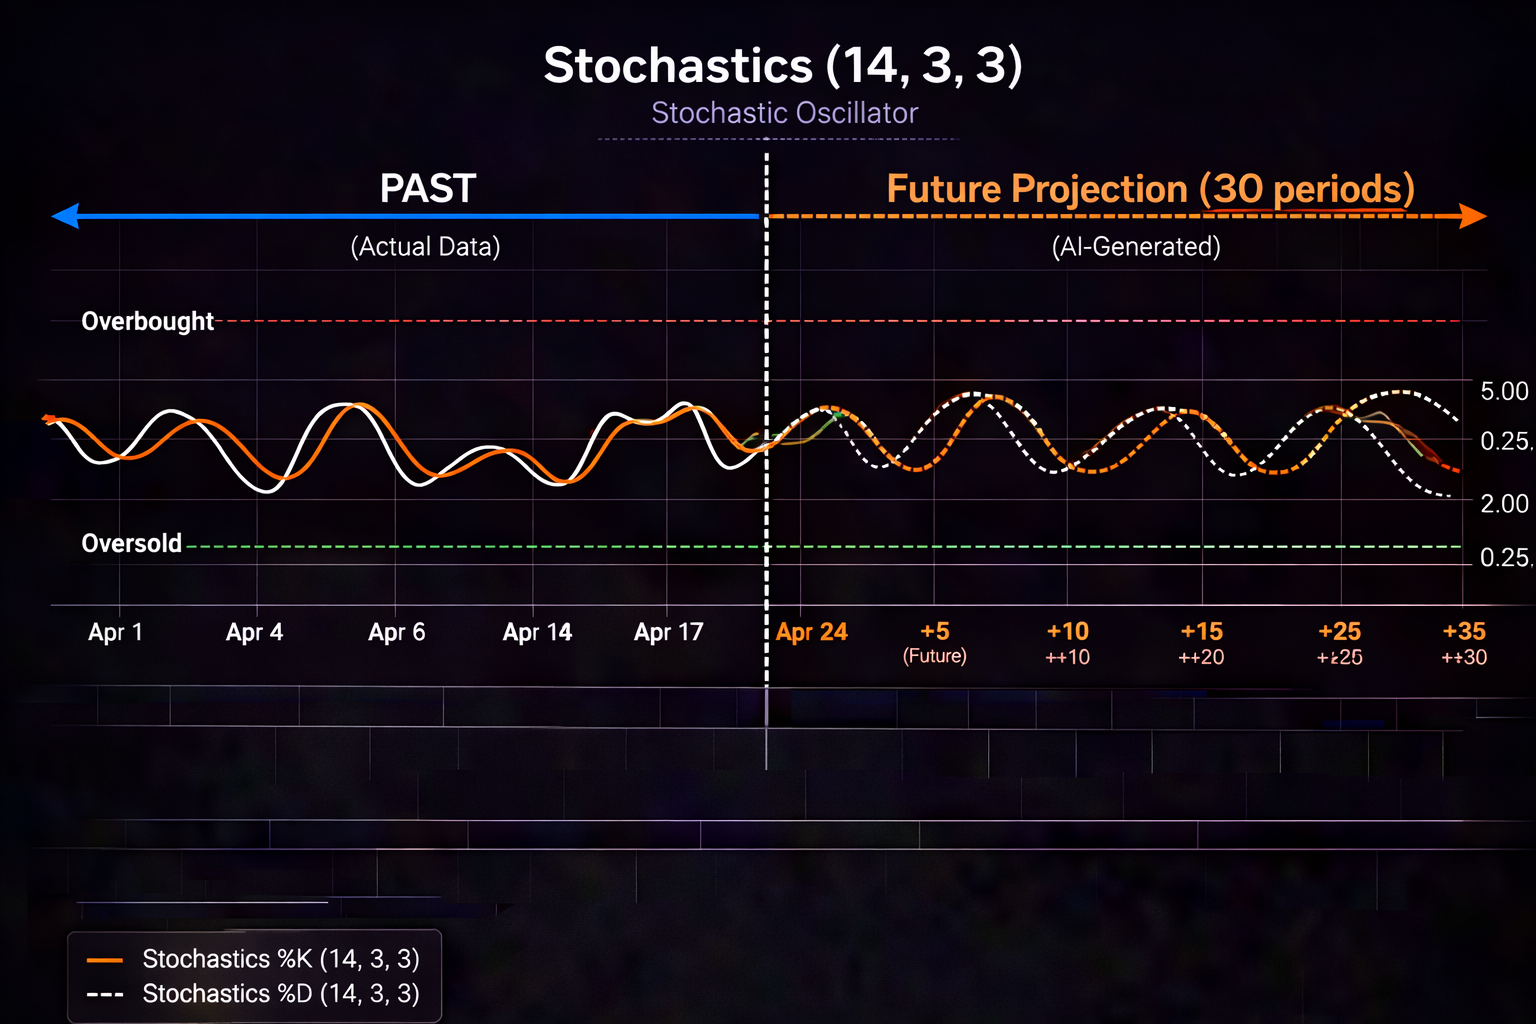
Stochastics: Identifies overbought/oversold conditions. Readings above 80 suggest overbought. Readings below 20 suggest oversold. Stochastic crossovers in extreme zones signal potential reversals. Divergences warn of momentum exhaustion.
Each indicator serves a purpose. Don't add indicators that duplicate information (e.g., MACD and RSI both measure momentum—choose one). Layer indicators that answer different questions.
Start with weekly chart: Identify primary trend and major support/resistance
Move to daily chart: Identify intermediate trend and key levels
Analyze 4-hour chart: Identify developing setups
Use 1-hour or 15-minute chart: Time entries precisely
Alignment across timeframes increases conviction. When weekly, daily, and 4-hour charts all show bullish structure, long trades carry higher probability. When timeframes conflict, reduce size or stand aside.
PredictIndicators.ai's multi-platform availability—NinjaTrader 8, MT5, iPhone, iPad, Android, Mac, web—means your multi-timeframe analysis workflow stays consistent regardless of device. Your forecasting inputs don't change when switching from desktop to mobile.
Layer 4: Market Context Integration
Analysis doesn't happen in isolation. Context shapes interpretation:
Session Timing: Forex markets have London, New York, Tokyo sessions. Each session has characteristic volume and volatility patterns. Know which session you're trading and adjust expectations accordingly.
News Events: Economic data releases (NFP, CPI, FOMC) create volatility spikes. Reduce exposure around major news. Don't fight news-driven momentum without clear reversal confirmation.
Market Regime: Trending markets reward trend-following approaches. Ranging markets reward mean-reversion approaches. Volatile markets reward wider stops and smaller sizes. Quiet markets reward tighter stops and normal sizing.
Correlation Awareness: Related instruments often move together (EUR/USD and GBP/USD, ES and NQ, gold and silver). Don't take conflicting directional bets on correlated instruments without understanding the divergence.
Context transforms raw analysis into actionable insight. The same technical setup means different things in different contexts.
Step-by-Step Analysis Tutorials
Let's walk through specific analysis scenarios:
Tutorial 1: Reading a Swing High Setup
Scenario: Price has rallied for 5 days. You're watching for potential reversal or continuation.
Step 1 - Price Structure: Mark the swing high. Identify prior support levels below. Note whether price is making higher highs (continuation signal) or struggling to make new highs (exhaustion signal).
Step 2 - Candlestick Signals: Watch for bearish reversal patterns at the high: shooting stars, bearish engulfing, evening stars. These gain significance when occurring at resistance.
Step 3 - Momentum Check: Look at MACD. Is it making higher highs with price (confirmation) or lower highs (bearish divergence)? Check Stochastics. Are they above 80 (overbought) or pulling back from extremes?
Step 4 - Volume Assessment: Is volume expanding on the rally (conviction) or contracting (loss of interest)? Declining volume on new highs suggests fading momentum.
Step 5 - AI Forecasting Integration: Check PredictIndicators.ai 30-bar projections. Do they show potential Stochastic exhaustion approaching? MACD bearish crossover developing? Bearish candlestick patterns forming? These projections add forward-looking context to your current read.
Step 6 - Decision Framework:
If price structure remains bullish AND momentum confirms AND projections don't show near-term reversal → Consider long continuation (tighter stop below prior swing low)
If price struggles AND momentum diverges AND projections show potential reversal → Consider short setup (stop above swing high)
If signals conflict → Reduce size or stand aside until clarity emerges
This tutorial demonstrates layered analysis: price, indicators, volume, forecasting, then decision. Each layer informs the next.
Tutorial 2: Reading a Pullback Entry
Scenario: Strong uptrend has pulled back 3 bars. You're evaluating whether to enter long.
Step 1 - Trend Confirmation: Verify the primary trend remains intact on higher timeframes. Don't buy pullbacks in downtrends hoping for reversals.
Step 2 - Pullback Depth: Measure retracement against the prior swing. 38.2% Fibonacci retracements often offer support in strong trends. 61.8% retracements suggest deeper correction.
Step 3 - Support Confluence: Does the pullback reach a prior resistance-turned-support level? Moving average? Volume node? Multiple confluence factors increase bounce probability.
Step 4 - Candlestick Trigger: Wait for bullish confirmation at support: hammer, bullish engulfing, morning star. Don't enter mid-pullback—wait for reversal signals.
Step 5 - Momentum Check: Is MACD holding above zero (bullish bias intact)? Are Stochastics bouncing from oversold (reversal signal)? Momentum should confirm the bounce.
Step 6 - AI Forecasting Integration: Check PredictIndicators.ai projections. Do they show bullish MACD crossovers developing 30 bars ahead? Stochastics rising from oversold? Bullish candlestick patterns forming? Forward-looking confirmation adds conviction.
Step 7 - Risk Definition: Place stop below the pullback low (or below confluence support). Size position based on stop distance and account risk tolerance (e.g., 2% max risk).
Step 8 - Entry Execution: Enter on close of bullish confirmation candle. Don't anticipate—wait for signal completion.
This tutorial emphasizes patience: wait for pullback, wait for support, wait for confirmation, then enter. Each wait filters lower-quality setups.
Tutorial 3: Reading a Breakout
Scenario: Price has consolidated for 10 bars. Resistance level is clear. You're watching for breakout.
Step 1 - Consolidation Type: Is this a bull flag (bullish continuation)? Bear flag (bearish continuation)? Symmetrical triangle (directional bias unclear)? Rectangle (range-bound)? Pattern type suggests probable breakout direction.
Step 2 - Volume Profile: Is volume contracting during consolidation (normal) or expanding (potential accumulation/distribution)? Contracting volume suggests coiling energy. Expanding volume suggests active positioning.
Step 3 - Breakout Confirmation: Wait for close outside the consolidation range. Don't enter on wicks piercing resistance—wait for decisive closes.
Step 4 - Volume Confirmation: Breakout should occur on expanding volume. Low-volume breakouts often fail (lack of conviction).
Step 5 - Retest Behavior: Many breakouts retest the broken level. Bullish breakouts retest resistance-turned-support. Bearish breakouts retest support-turned-resistance. Retest entries offer better risk/reward but risk missing the move if no retest occurs.
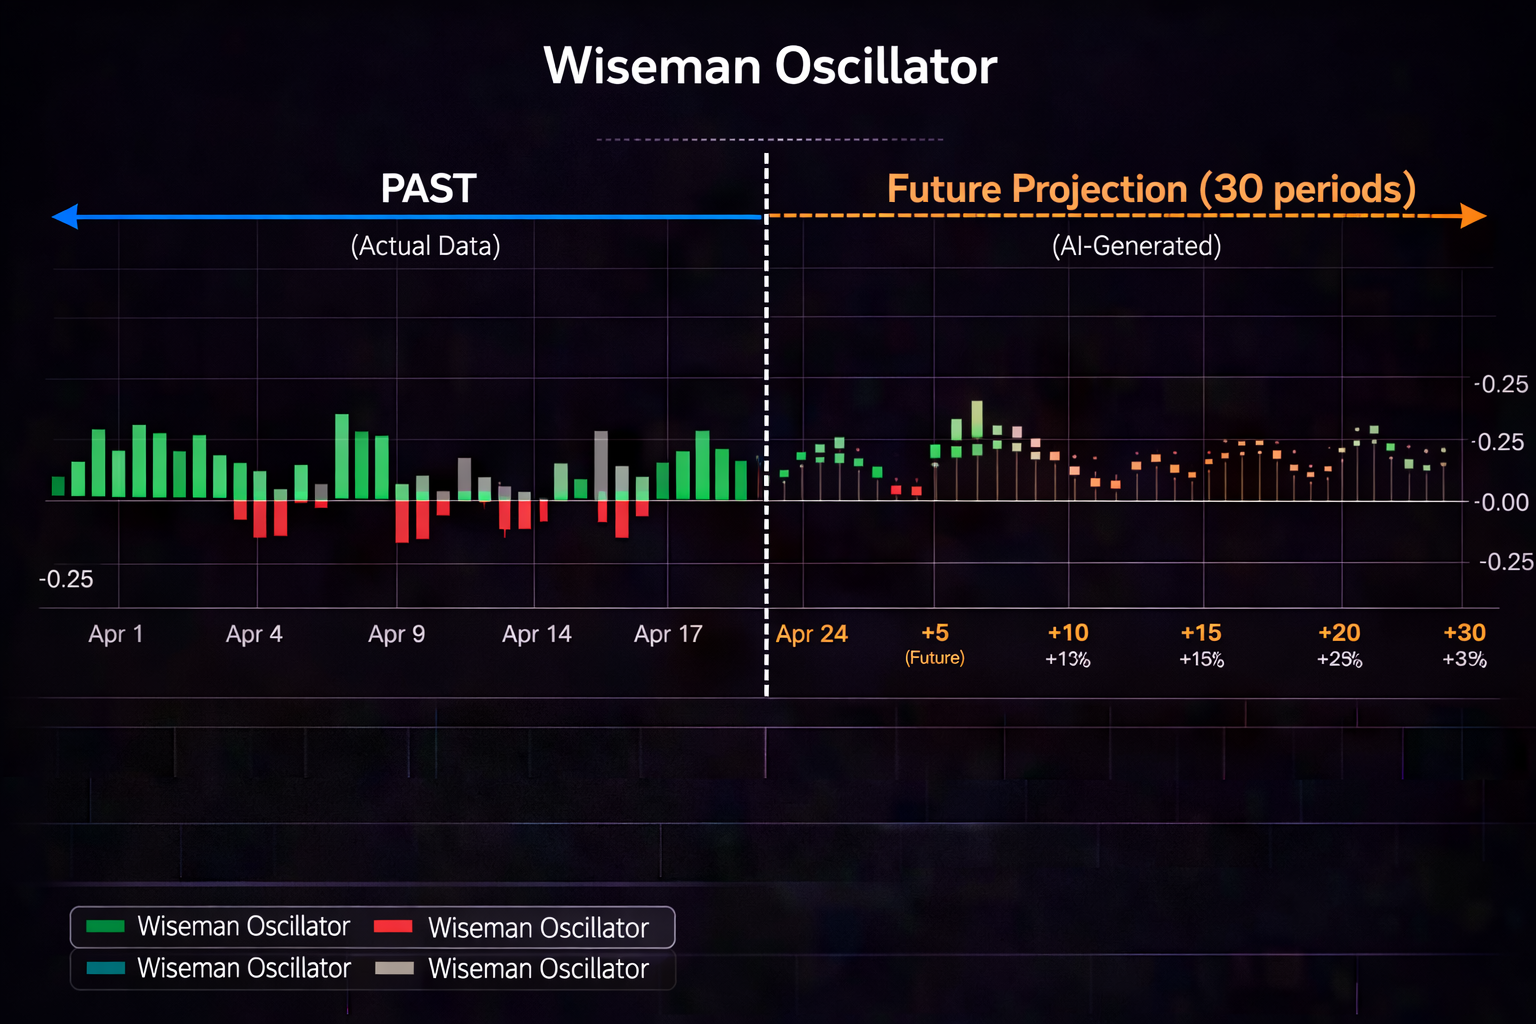
Step 6 - AI Forecasting Integration: Check PredictIndicators.ai projections. Do they show momentum expansion (MACD histogram growth) developing 30 bars ahead? Volatility expansion (ATR growth)? Bullish/bearish candlestick continuity? Projections confirm whether breakout has follow-through potential.
Step 7 - Stop Placement: For breakout entries, place stops inside the consolidation range (below breakout candle low for bullish breaks, above breakout candle high for bearish breaks). This invalidates the breakout thesis if hit.
Step 8 - Target Definition: Measure the consolidation height. Project that distance from the breakout point for initial target. Adjust based on nearby resistance/support levels.
This tutorial emphasizes breakout confirmation: pattern identification, volume confirmation, close confirmation, then entry. False breakouts are common—confirmation filters them.
Common Analysis Mistakes and Corrections
Even experienced traders fall into analysis traps. Recognition enables correction:
Indicator Overload
Mistake: Adding 10+ indicators to charts, creating visual noise and conflicting signals.
Mistake: Endlessly analyzing without executing. Waiting for "perfect" setups that never materialize.
Correction: Define clear entry criteria in advance. When criteria are met, execute. Accept that no setup is perfect. Probability, not certainty, governs outcomes.
Confirmation Bias
Mistake: Reading charts to confirm existing bias rather than evaluating objectively.
Correction: Actively seek disconfirming evidence. If you're bullish, ask "What would make this trade wrong?" If you can't answer, you're not thinking clearly.
Neglecting Risk Definition
Mistake: Identifying setups without defining stops and position size beforehand.
Correction: Before entering, know exactly where you're wrong (stop level) and how much you're risking (position size). Analysis without risk definition is gambling, not trading.
Integrating AI Forecasting into Analysis Workflows
AI forecasting tools like PredictIndicators.ai enhance analysis without replacing core skills:
Forecasting as Confirmation
When your analysis suggests a bullish setup, check AI projections. Do they confirm momentum continuation? Stochastics rising from oversold? Bullish candlestick patterns forming? Confirmation increases conviction.
When projections conflict with your read, don't override—pause. Ask: "What am I missing?" Maybe momentum is exhausting despite bullish price action. Maybe volatility is about to expand. Projections surface what current charts don't show.
Forecasting as Risk Calibration
Use projections to adjust risk parameters. If PredictIndicators.ai shows ATR expansion approaching, widen stops and reduce size. If projections show volatility contraction, tighten stops and maintain normal size.
This calibration makes risk dynamic, not static. You're respecting upcoming conditions, not just current ones.
Forecasting as Patience Anchor
Forward-looking data reduces FOMO. When you see potential setups developing 30 bars ahead, you don't chase current moves. You wait for confluence between current price action and future projections.
This patience distinguishes thoughtful traders from reactive ones. Analysis becomes anticipatory, not reactive.
Platform Consistency
PredictIndicators.ai's availability across NinjaTrader 8, MT5, iPhone, iPad, Android, Mac, and web ensures your forecasting-enhanced analysis works consistently everywhere. You're not relearning workflows when switching devices. The same forecasting logic applies whether you're at your desk or on your commute.
Analysis Workflow Documentation
Document your analysis process to build consistency:
Limitations: Performance depends on internet connectivity. Advanced features may be reduced vs. native platforms.
Best for: Accessible analysis from any device, traders valuing flexibility over native performance.
PredictIndicators.ai integration: Web-based forecasting ensures projection data available regardless of device constraints.
Final Thoughts: Analysis as Continuous Learning
Market analysis isn't a skills you master once. It's a practice you refine continually. Markets evolve. Regimes shift. New tools emerge. Your analysis must adapt while honoring fundamentals.
PredictIndicators.ai exemplifies this evolution across all platforms—NinjaTrader 8, MT5, iPhone, iPad, Android, Mac, and web. AI forecasting doesn't replace price reading, indicator analysis, or multi-timeframe awareness. It enhances them with forward-looking context that traditional technical analysis can't access.
Your analysis future isn't choosing between human judgment and computational insight. It's integrating both. Price action teaches you market language. Indicators quantify momentum and volatility. AI forecasting shows where current patterns might lead. Your judgment brings them together.
That synthesis—human pattern recognition augmented by machine learning projections—is where modern market analysis leads. And that's where sustainable trading careers begin.