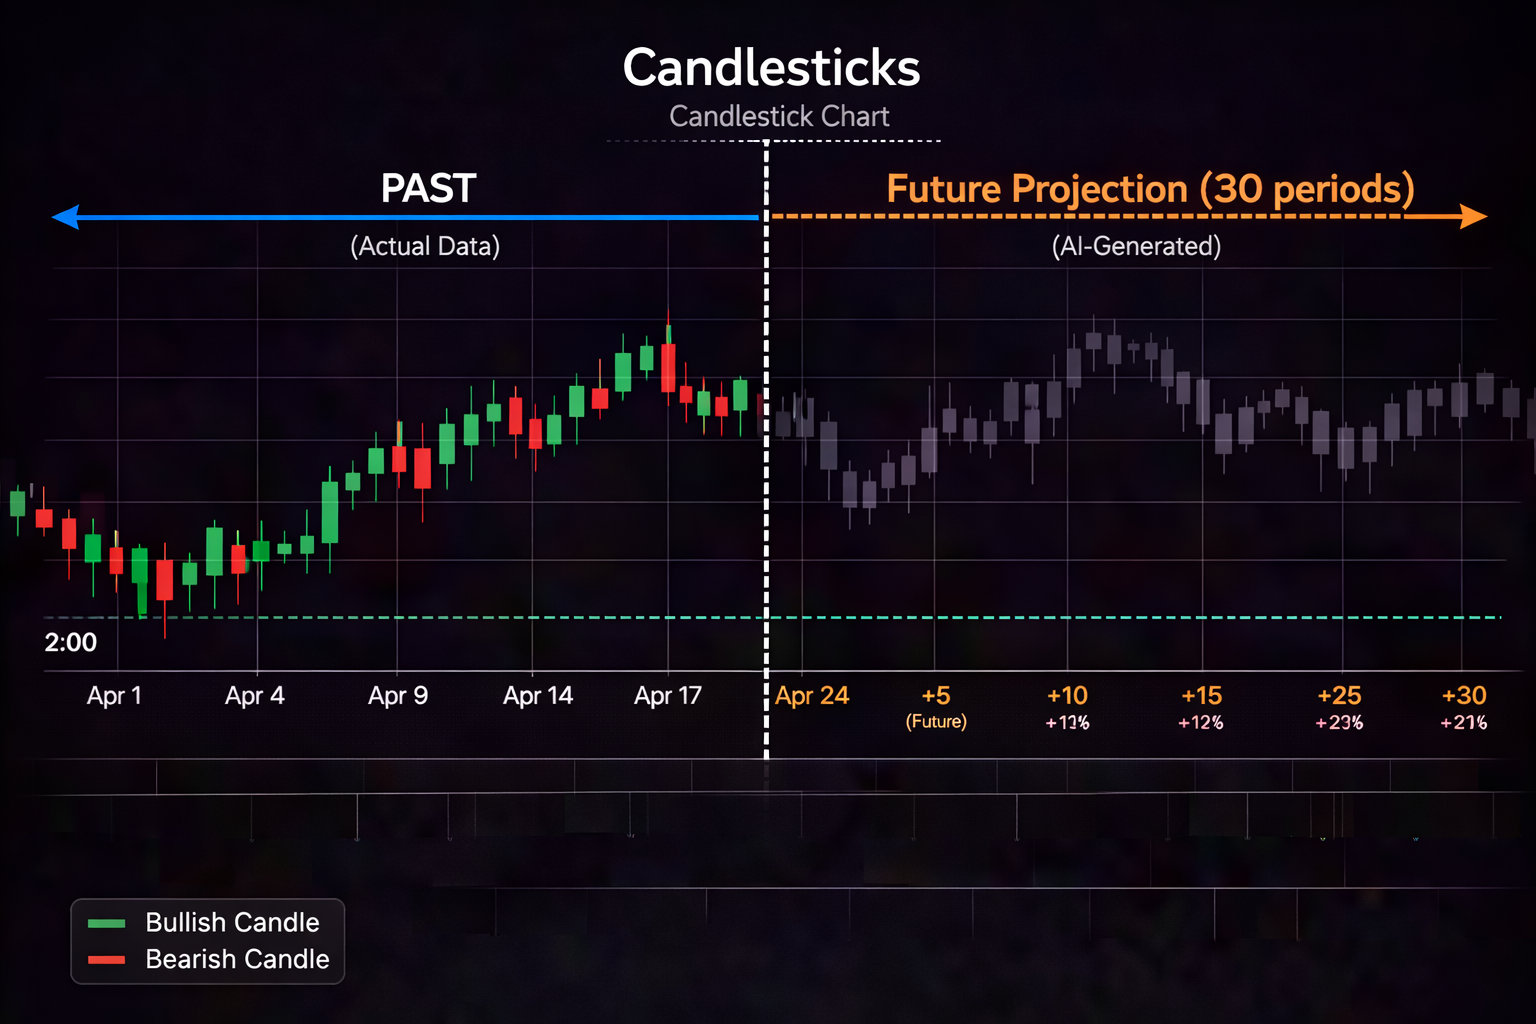
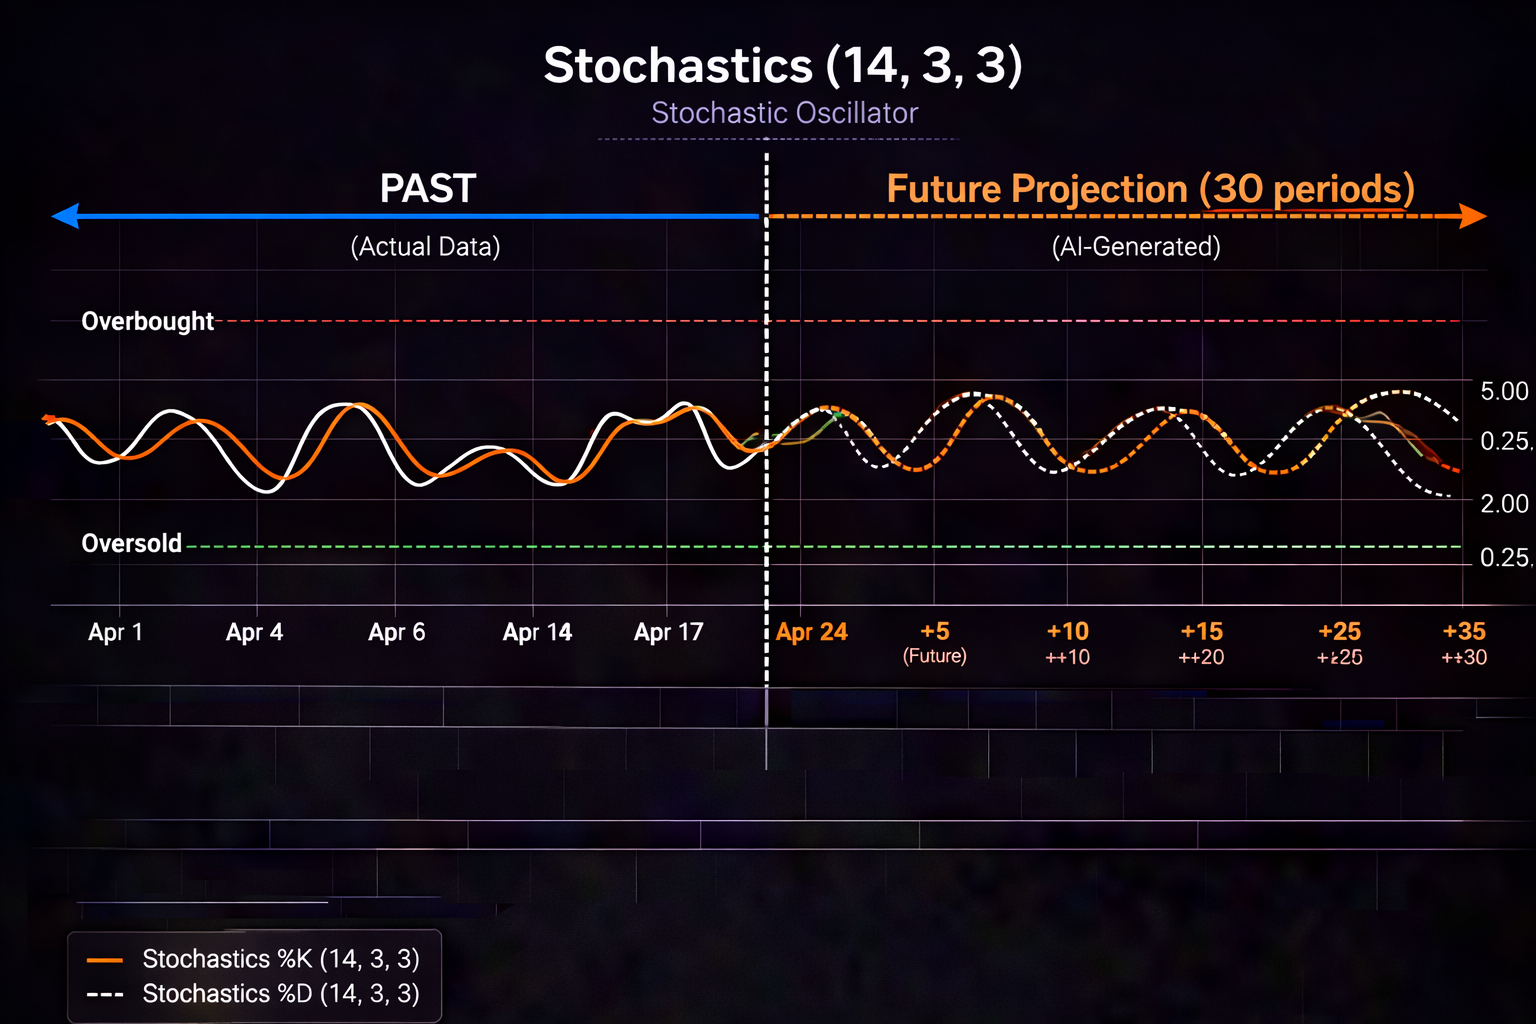
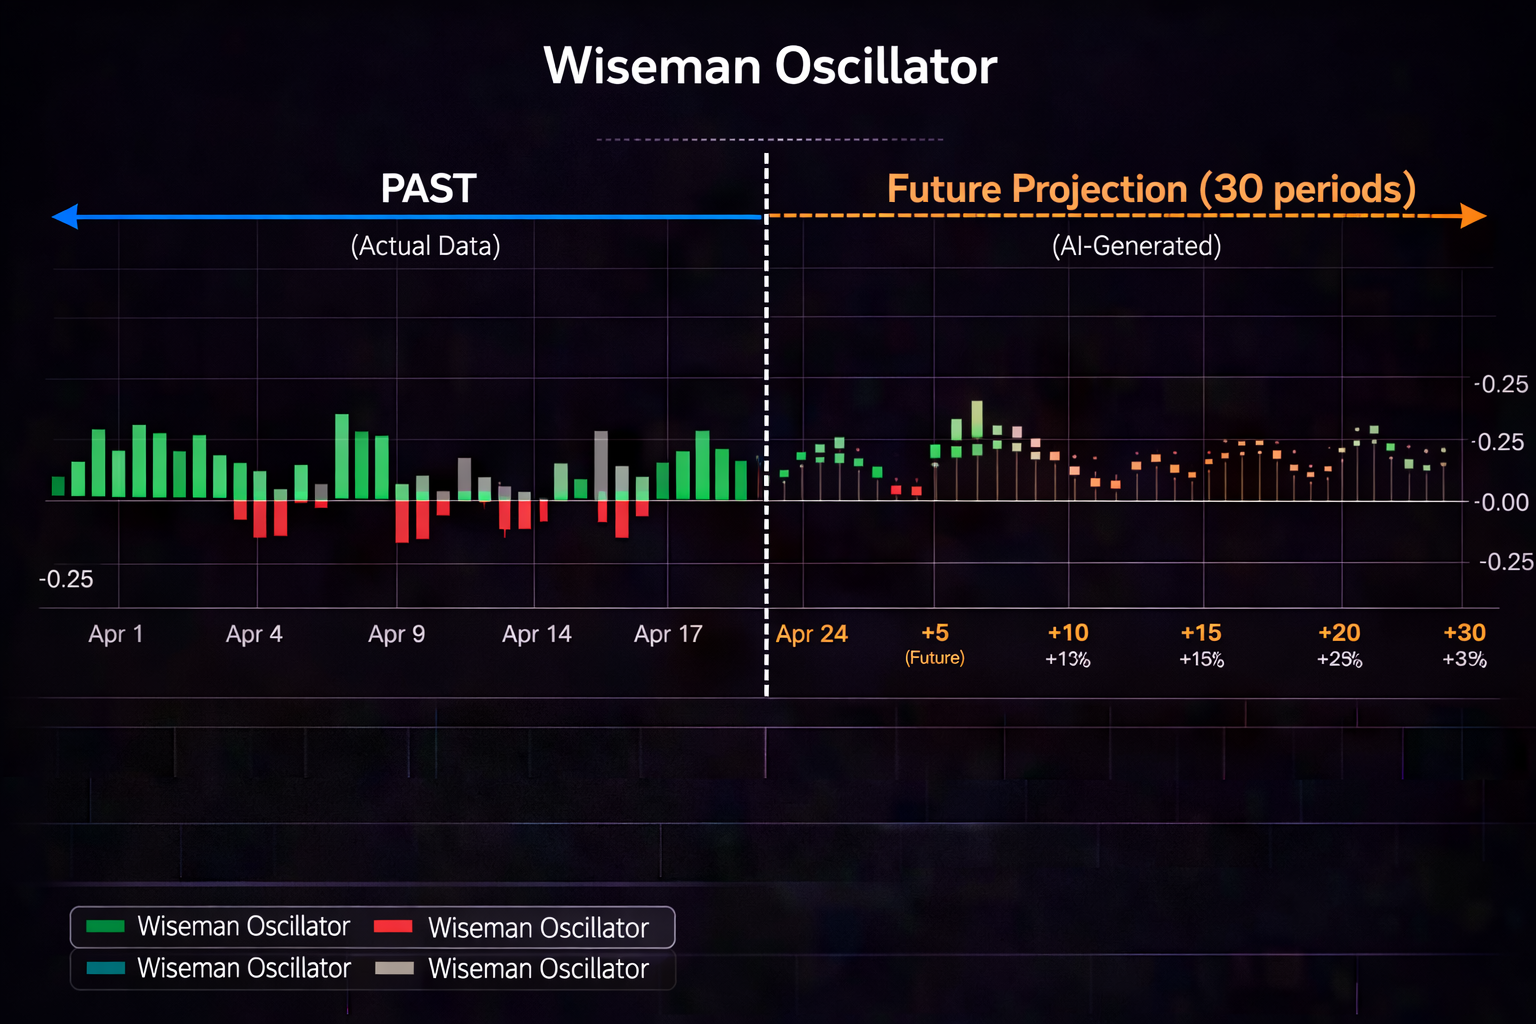
"I have a feel this is going up." "This setup looks good." "My gut says wait."
If these phrases live in your trading journal, you're not trading—you're guessing with confidence.
Quantitative trading replaces feelings with data, guesses with statistics, and hope with measurable edge. It's not about complex math or PhD-level modeling. It's about asking: "What does the data say?" before every trade.
For retail traders, quantitative methods mean three things:
This is where AI-powered tools like PredictIndicators.ai transform retail trading. Instead of subjective "this looks bullish," you get: "High confidence MACD cross forecast in 7 bars, 68% historical realization rate, avg 2.3:1 reward when aligned with trend." That's quantitative. That's actionable. That's available on every platform—NinjaTrader 8, MetaTrader 5, iPhone, iPad, Android, Mac app, and web app.
Retail traders avoid "quantitative" because they picture: high-frequency trading firms, million-dollar infrastructure, PhD quants writing stochastic differential equations.
That's institutional quant trading. Retail quantitative trading is different:
| Institutional Quant | Retail Quant |
|---|---|
| Microsecond execution | Seconds to minutes execution (perfectly fine) |
| Thousands of trades/day | 5-20 trades/week (quality over quantity) |
| Complex stochastic models | Simple statistics: win rate, reward:risk, expectancy |
| Proprietary data feeds | Standard price data + predictive indicators |
| Team of quants + devs | Solo trader with disciplined process |
Retail quantitative trading = using data to make better decisions than your competitors (other retail traders) who trade onfeelings.
You don't need infrastructure arms race. You need information advantage.
Win rate = winning trades / total trades. Simple. But most traders calculate it wrong.
Wrong way: "I won 7 of my last 10 trades = high!" (Cherry-picked sample, ignores losing trades that happened earlier)
Right way: Track every trade for 100+ trades. No exclusions. No "that wasn't a real trade" retcons.
CORRECT WIN RATE CALCULATION:
Total trades (100+ sample): 127
Winning trades: 74
Losing trades: 53
Win rate: 74 / 127 = 58.3%

CONFIDENCE INTERVAL (95%):
±8.9% (true win rate likely between 49.4% - 67.2%)
Sample size matters. 10 trades = meaningless variance. 100+ trades = statistical significance.
With PredictIndicators.ai, segment win rate by forecast confidence:
HIGH CONFIDENCE SIGNALS (72 trades): high
MEDIUM CONFIDENCE SIGNALS (41 trades): high
LOW CONFIDENCE SIGNALS (14 trades): high

QUANTITATIVE RULE:
Only trade high confidence (68% > 50% = positive edge)
Skip medium/low (not statistically advantageous)
This works across all platforms—NinjaTrader 8, MT5, iPhone, iPad, Android, Mac app, web app. Confidence segmentation doesn't change with your device.
Award:risk = average winner size / average loser size. This is where most traders lie to themselves.
Common delusion: "I target 2:1 on every trade!" (Target ≠ realization)
Reality: Measure what you actually achieved, not what you planned.
PLANNED vs. REALIZED R:R:

Planned (what you told yourself):
- Target: 2:1 minimum
- Expectation: 2.0:1 average

Realized (what actually happened, 100 trades):
- Average winner: +14 ticks
- Average loser: -9 ticks
- Realized R:R: 14 / 9 = 1.56:1

GAP ANALYSIS:
Why the difference?
- Exited early on 23 trades (fear, took 0.8:1 avg)
- Moved stops wider on 11 trades (hope, increased loss size)
- Chased entries on 8 trades (worse R:R from start)

FIX:
Address execution gaps, not target fantasies
Quantitative trading = measuring realization, not aspiration.
Expectancy = (win rate × avg winner) - (loss rate × avg loser). This is your true edge per trade.
EXAMPLE CALCULATION (100 trades):

strong performance (0.58)
Loss rate: 42% (0.42)
Avg winner: +16 ticks
Avg loser: -10 ticks

EXPECTANCY:
= (0.58 × 16) - (0.42 × 10)
= 9.28 - 4.2
= +5.08 ticks per trade

INTERPRETATION:
Every trade, on average, earns +5.08 ticks
Over 100 trades: +508 ticks expectation
Over 500 trades: +2,540 ticks expectation

THIS IS YOUR EDGE:
Not "I feel good about this trade"
But "this setup has +5.08 tick mathematical expectation"
Positive expectancy = keep trading the setup. Negative expectancy = stop trading it (no matter how "good it looks").
PredictIndicators.ai helps quantify expectancy per forecast type:
BULLISH MACD FORECAST (high confidence, 45 trades):
- strong performance
- Avg winner: +18 ticks
- Avg loser: -9 ticks
- Expectancy: (0.67 × 18) - (0.33 × 9) = 12.06 - 2.97 = +9.09 ticks

BEARISH STOCH FORECAST (medium confidence, 38 trades):
- strong performance
- Avg winner: +14 ticks
- Avg loser: -11 ticks
- Expectancy: (0.52 × 14) - (0.48 × 11) = 7.28 - 5.28 = +2.00 ticks

DECISION:
High confidence MACD = strong edge (+9.09/trade)
Medium confidence Stoch = weak edge (+2.00/trade)
Prioritize high confidence, limit medium, skip low
Sharpe ratio = (avg return - risk-free rate) / std dev of returns. For retail traders, simplify:
Sharpe ≈avg return per trade / standard deviation of returns
TRADER A:
- Avg return: +8 ticks/trade
- Std dev: 12 ticks
- Sharpe: 8 / 12 = 0.67

TRADER B:
- Avg return: +5 ticks/trade
- Std dev: 4 ticks
- Sharpe: 5 / 4 = 1.25

INTERPRETATION:
Trader B has lower avg return but higher consistency
Trader B's edge is more reliable (less variance)
Over time, Trader B compounds better despite lower avg

APPLICATION:
Don't just maximize expectancy—maximize consistency too
Tight stops, defined targets, rule-following = lower std dev = higher Sharpe
This applies whether you trade on NinjaTrader 8, MT5, or mobile (iPhone, iPad, Android, Mac app, web app). Consistency metrics are platform-agnostic.
Max drawdown = largest peak-to-trough decline in your equity curve. This is your "worst case" stress test.
EXAMPLE:
Account peak: $100,000
Lowest point after peak: $92,000
Drawdown: $8,000 = 8%

QUESTIONS TO ASK:
- Can you emotionally handle 8% drawdown?
- Does it exceed your risk tolerance?
- Did it come from rule-breaking or valid variance?

IF FROM RULE-BREAKING:
Fix discipline (drawdown preventable)

IF FROM VARIANCE (rules followed):
Accept as statistical reality
Ensure position sizing survives 2x this drawdown

QUANTITATIVE POSITION SIZING:
If max historical drawdown = 8%
Risk per trade = 0.5-1% (survive 8-16 consecutive losses)
Not 2-3% (blow up in drawdown)
Track these metrics weekly (30 minutes, same time every week):
| Metric | Formula | Target | Red Flag |
|---|---|---|---|
| Win Rate | Wins / Total Trades | >50% (with R:R ≥2:1) | <45% (revisit setup) |
| Reward:Risk | Avg Win / Avg Loss | ≥2.0:1 realized | <1.5:1 (fix targets/stops) |
| Expectancy | (WR×AW) - (LR×AL) | Positive (>0) | Negative (stop trading setup) |
| Rule Adherence | Rules Followed / Total Trades | >90% | <80% (discipline problem) |
| Sharpe (simplified) | Avg Return / Std Dev | >1.0 | <0.7 (too volatile) |
| Max Drawdown | Peak to Trough % | <10% | >15% (reduce risk per trade) |
Update weekly. Spot trends. Fix problems before they compound.
Tools like PredictIndicators.ai add quantitative layers:
Not all signals are equal. AI forecasts come with confidence levels. Quantify them:
CONFIDENCE SEGMENTATION (120 trades):

HIGH CONFIDENCE (78 trades):
- strong performance
- Avg R:R: 2.4:1
- Expectancy: +10.2 ticks/trade

MEDIUM CONFIDENCE (34 trades):
- strong performance
- Avg R:R: 1.7:1
- Expectancy: +1.1 ticks/trade

LOW CONFIDENCE (8 trades):
- strong performance
- Avg R:R: 1.2:1
- Expectancy: -2.8 ticks/trade

QUANTITATIVE RULE:
Trade high confidence only (66% WR + 2.4:1 R:R = strong edge)
Skip medium/low (not statistically advantageous)
This is quantified edge—not "I think high confidence feels better." Data proves it.
PredictIndicators.ai forecasts 30 bars ahead. Track how often forecasts realize:
FORECAST TYPE → REALIZATION RATE (100+ samples):

Bullish MACD cross (5-10 bars ahead): 71% realization
Bearish Stoch cross (8-12 bars ahead): 64% realization
Bullish ATR expansion (10-15 bars ahead): 58% realization
Price support hold (5-8 bars ahead): 76% realization
Price resistance break (10-15 bars ahead): 52% realization

INTERPRETATION:
Some forecast types realize more often than others
Trade higher-realization forecasts more heavily
Adjust position size by forecast type reliability
This works identically across all PredictIndicators.ai platforms (NinjaTrader 8, MT5, iPhone, iPad, Android, Mac app, web app). Forecast realization rates are consistent.
When forecasts align across timeframes, realization rates improve:
TIMEFRAME ALIGNMENT STUDY (85 trades):

ALIGNED (higher + middle TF both bullish): 52 trades
- strong performance
- Avg R:R: 2.5:1
- Expectancy: +11.4 ticks

CONFLICTED (higher bearish, middle bullish): 33 trades
- strong performance
- Avg R:R: 1.6:1
- Expectancy: -1.8 ticks

QUANTITATIVE RULE:
Only trade aligned timeframes (69% WR vs 44% WR)
Skip conflicted setups (negative expectancy)
Multi-timeframe alignment isn't "nice to have." It's quantitative edge (11.4 vs -1.8 expectancy = massive difference).
Trader: "I'm 4-1 on this setup = high!" (5 trades = statistical noise)
Fix: Minimum 100 trades before claiming edge. 50 trades = preliminary. 200+ = reliable.
Trader: "My last 20 trades were winners!" (Ignores 30 losers before that, or doesn't count "I didn't take that trade" as data)
Fix: Log every signal that fired, whether you took it or not. Track "signal fired → traded" and "signal fired → skipped" separately.
Trader: "This setup works perfectly when RSI is 47-53 and price is above 20 EMA by 2.3 ticks..." (Over-optimized, fails on new data)
Fix: Simple rules (1-2 variables max). Test out-of-sample (Jan-Mar data → Apr-Jun test). If performance drops 50%+, you curve-fit.
Trader tracks metrics on NinjaTrader 8 but trades on iPhone without syncing data. Metrics fragment, edge dissolves.
Fix: Use tools that maintain data consistency across platforms. PredictIndicators.ai provides uniform forecasting on all eight platforms (NinjaTrader 8, MT5, iPhone, iPad, Android, Mac app, web app). Your quantitative tracking stays intact whether at desk or mobile.
David traded ES futures for 4 years. Pattern: 3 months up, 1 month down (gave back profits). He started quantitative tracking:
- "I feel good about this trade" (no metrics)
- Win rate unknown (didn't track)
- R:R "should be 2:1" (didn't measure realization)
- Drawdown: 18% (emotional devastation, revenge traded)
- Net: +12% for year (volatile, stressful)
METRICS DISCOVERED:
- True strong performance (not "I'm hot/corn")
- Realized R:R: 1.7:1 (not 2:1 target fantasy)
- Expectancy: +4.2 ticks/trade (positive, but modest)
- Rule adherence: 78% (22% of trades broke rules)
- Drawdown: 9% (within tolerance, no emotional damage)

CHANGES MADE:
1. Only traded high-confidence PredictIndicators.ai forecasts
   (lifted win rate from 54% → 66%)
2. Fixed early exits (lifted R:R from 1.7:1 → 2.2:1)
3. Enforced rule adherence (78% → 94% via accountability)
4. Reduced position size 20% (lowered drawdown 9% → 6%)

RESULT YEAR 4:
- strong performance
- R:R: 2.2:1
- Expectancy: +9.1 ticks/trade (doubled from +4.2)
- Drawdown: 6% (emotionally manageable)
- Net: +31% for year (3x Year 3, half the stress)
David didn't get smarter. He got quantitative. Data replaced feelings. Edge compounded.
He validated this on NinjaTrader 8 and the iPhone app—metrics aligned within 2% variance. His quantitative edge traveled with him.
Trading without quantitative metrics = sailing without instruments. You think you know where you are. You're actually drifting.
Quantitative methods give you:
AI-powered tools like PredictIndicators.ai make this accessible: forecast confidence quantification, realization rate tracking, multi-timeframe alignment measurement—on every platform (NinjaTrader 8, MetaTrader 5, iPhone, iPad, Android, Mac app, web app).
Track 100 trades. Calculate your metrics. Fix what the data reveals. Repeat. Within 6 months, you'll trade with confidence that feeling-based traders will never touch.
Not because you're smarter. Because you're quantitative.