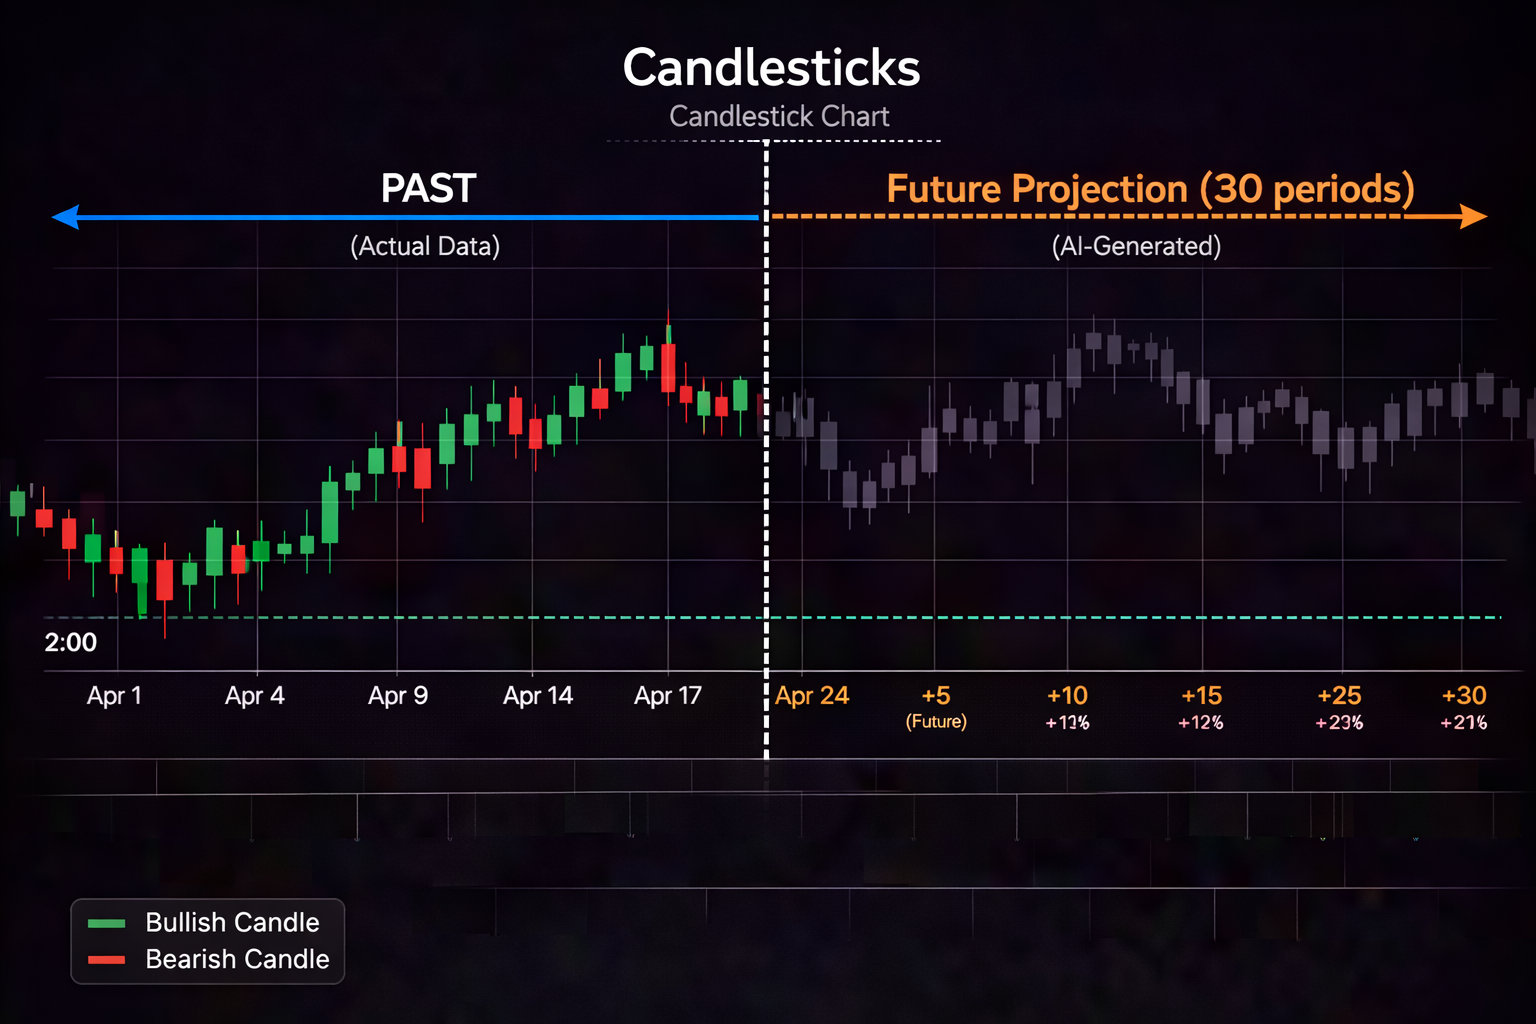
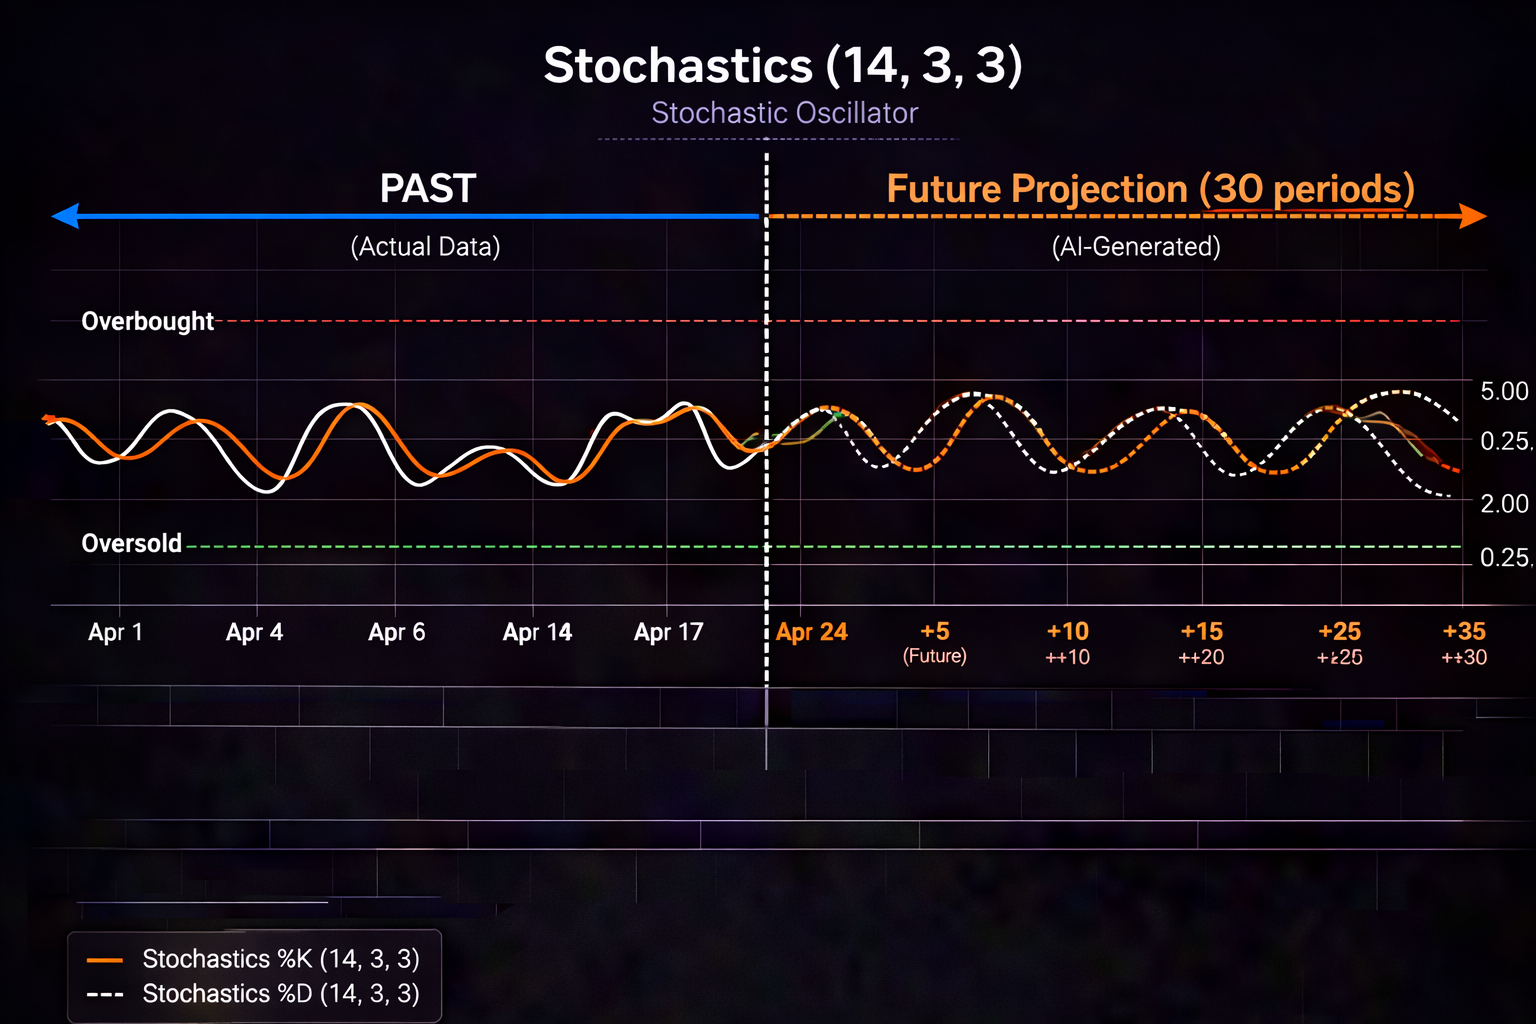
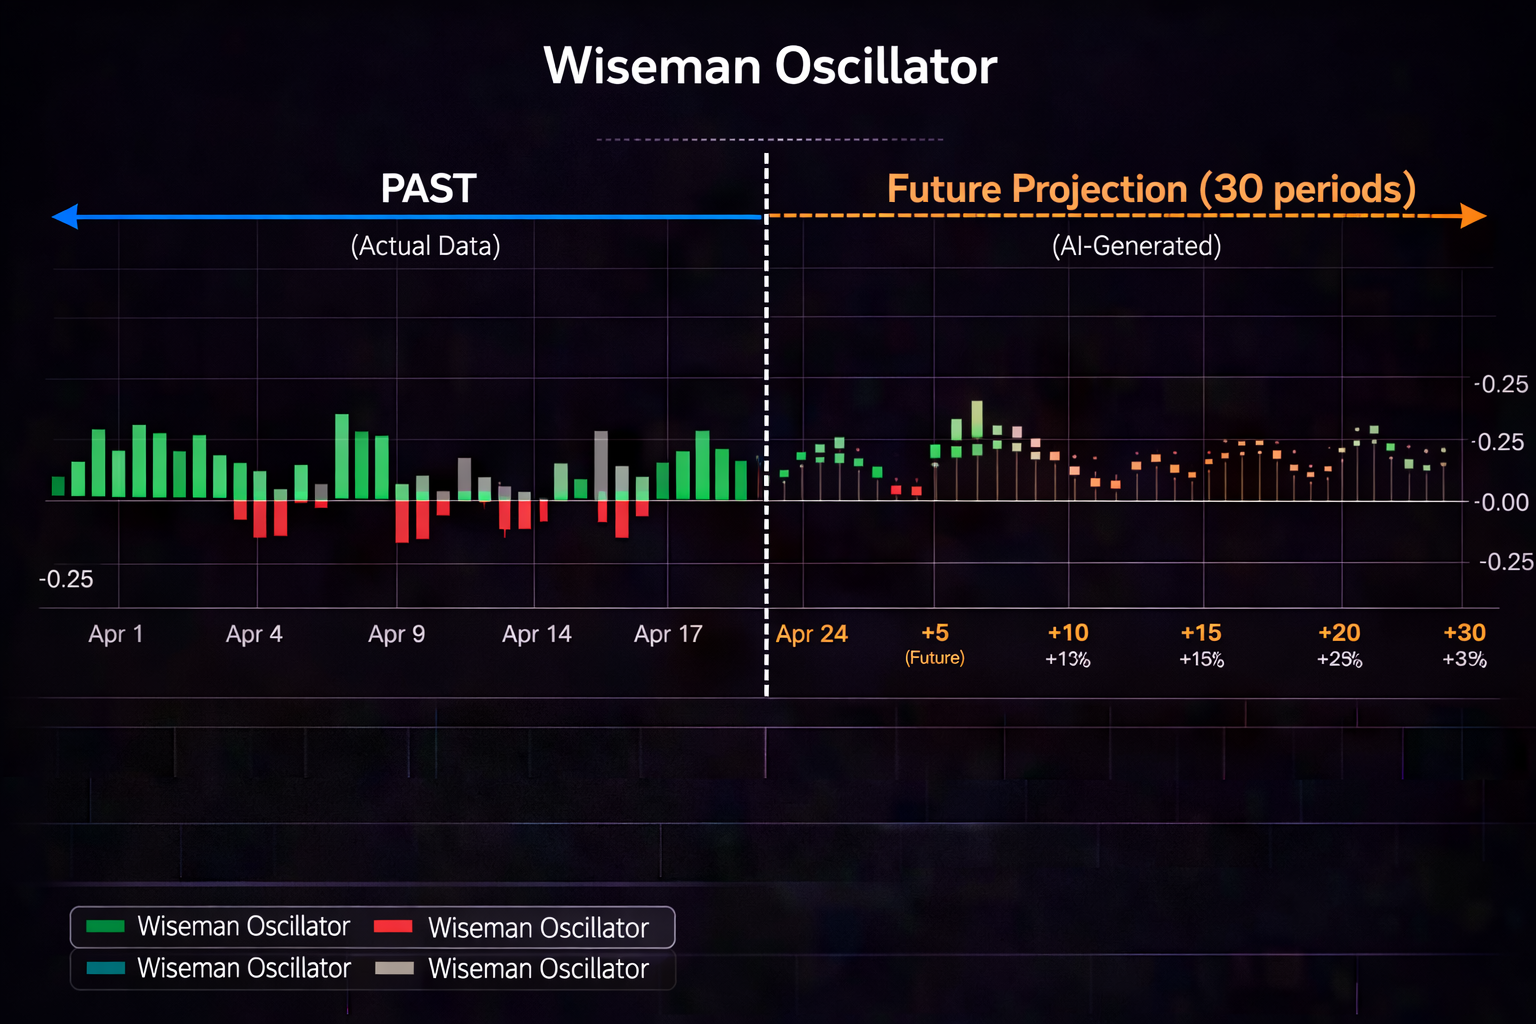
You're watching a 5-minute chart. MACD crosses bullish. Price breaks above resistance. You enter long. Three bars later, you're stopped out as price reverses hard.
What you saw: clean breakout on 5-minute.
What you missed: 15-minute and 1-hour charts showed price grinding into major resistance from a 3-day downtrend. The "breakout" was a 5-minute headfake against higher-timeframe pressure.
This is why multi-timeframe analysis separates consistent traders from chop-out victims. No single timeframe tells the full story. The 5-minute shows entry timing. The 15-minute shows trend context. The 1-hour shows key levels. The 4-hour shows market regime.
Missing any layer = trading blind. Mastering all layers = trading with context. And when you layer in AI-powered prediction from PredictIndicators.ai—which forecasts indicators 30 bars ahead across all timeframes—you get timing and foresight.
PredictIndicators.ai works on every platform you use: NinjaTrader 8, MetaTrader 5, iPhone, iPad, Android, Mac app, and web app. Your multi-timeframe edge doesn't vanish when you switch devices.
Single-timeframe traders make three fatal mistakes:
A 5-minute breakout against 1-hour trend is usually a trap. Without higher-timeframe context, you can't tell the difference between genuine momentum and counter-trend noise.
Fix: Always check one timeframe higher before entering. If 5-minute is your trading chart, 15-minute tells you trend. If 15-minute is your chart, 1-hour tells trend.
Support/resistance on your trading timeframe might be meaningless noise on a higher timeframe. Or worse—you're buying into major resistance you didn't see because it only appears on the 1-hour chart.
Fix: Mark levels on two timeframes higher than your trading chart. These are the levels that actually matter.
Strong 5-minute momentum can look like trend change. But on 1-hour, it might be a pullback into value in a larger downtrend. You're buying a dip in a bear market and calling it a reversal.
Fix: Compare momentum across timeframes. If 5-minute is bullish but 15-minute and 1-hour are bearish, you're counter-trend trading (lower probability, tighter stops required).
You don't need to analyze 10 timeframes. Three is the sweet spot:
| Timeframe | Purpose | What to Analyze | Decision Weight |
|---|---|---|---|
| Higher (2-3x your trading TF) | Trend & regime context | Overall direction, major levels, market structure | 40% (sets bias) |
| Middle (your trading TF) | Setup & signal timing | Entry triggers, indicator signals, pattern completion | 40% (triggers action) |
| Lower (for entry precision) | Execution refinement | Fine-tune entry, tighten stops, manage early exit | 20% (optimizes execution) |
Examples:
Pick your "trading timeframe" based on your style. Then add one higher for context, one lower for precision. Done.
This framework works identically whether you're on NinjaTrader 8, MT5, or mobile (iPhone, iPad, Android, Mac app, web app). Timeframe relationships don't change with your device.
The highest-probability trades occur when timeframes align. Not perfectly—but mostly.
Example: Long setup on ES futures (5-minute trading chart)
HIGHER (15-minute):
- Trend: Bullish (higher highs, higher lows)
- Price: Pulled back to 15-min support (confluent with 5-min demand zone)
- Bias: Long preferred

MIDDLE (5-minute):
- Signal: PredictIndicators.ai forecasts bullish MACD cross in 6-8 bars (high confidence)
- Pattern: Double bottom forming at 15-min support confluence
- Setup: Valid per your rules

LOWER (1-minute):
- Entry: Price holding above double bottom low
- Stop: Can be placed 2 ticks below swing, clean risk definition
- Execution: Limit order fills at planned level

DECISION:
✓ Timeframes align (bullish higher TF, bullish signal middle TF, clean entry lower TF)
✓ Risk defined
✓ Reward:risk ≥ 2:1
→ ENTER LONG
Now example of misalignment (stay away):
HIGHER (15-minute):
- Trend: Bearish (lower highs, lower lows)
- Price: Rallying into 15-min resistance (major level from prior breakdown)
- Bias: Short preferred / long caution

MIDDLE (5-minute):
- Signal: Bullish MACD cross fires
- Pattern: Looks like breakout
- Setup: Appears valid superficially

LOWER (1-minute):
- Entry: Price extending, not pulling back
- Stop: Would need to be wide (below 5-min swing, far away)
- Execution: Chase entry required

DECISION:
✗ Timeframes conflict (bearish higher TF, bullish middle TF = counter-trend)
✗ Entering at higher-TF resistance
✗ Reward:risk poor (wide stop, extended entry)
→ SKIP TRADE
The second setup might work. But it's counter-trend, into resistance, with poor risk definition. Lower probability. PredictIndicators.ai might still fire the signal—but multi-timeframe context tells you to pass.
AI-powered tools like PredictIndicators.ai add a critical layer: 30-bar forecasts on each timeframe.
This transforms multi-timeframe analysis from "what's happening now" to "what's likely to happen next on each layer."
Example workflow:
Interpretation:
You're still taking the trade (timeframes align short-term), but you're managing it differently because you know higher-TF pressure is building. That's predictive context—only available with tools that forecast ahead.
This works across all PredictIndicators.ai platforms: NinjaTrader 8, MT5, iPhone, iPad, Android, Mac app, web app. Forecast alignment checks are identical regardless of device.
Some traders open 8 timeframes, freeze, and miss trades. More timeframes ≠ better decisions.
Fix: Stick to three. Higher (context), middle (signal), lower (execution). No more.
Traders give equal weight to all timeframes. Then 1-minute noise contradicts 1-hour trend, and they freeze.
Fix: Higher timeframe = 40% weight. Trading timeframe = 40%. Lower = 20%. If higher TF says bearish, you don't take bullish trades unless they're high-probability counter-trend setups (rare, advanced).
Traders set up multi-timeframe analysis on desktop (NinjaTrader 8 or MT5), then check only one timeframe on mobile when traveling. Edge fragments.
Fix: Use tools that maintain consistency across platforms. PredictIndicators.ai provides 30-bar forecasts on all eight platforms—NinjaTrader 8, MT5, iPhone, iPad, Android, Mac app, web app. Your multi-timeframe process stays intact whether at your desk or on the go.
Markets shift. A 15-minute uptrend becomes a 15-minute downtrend. Traders locked into "higher TF is bullish" miss the transition.
Fix: Re-assess higher timeframe every 2-4 hours (or every 10-15 bars on your trading TF). Trends change. Update bias accordingly.
Jennifer trades NQ futures (15-minute chart). Here's her complete process:
- Trend: Bullish (price above 50 EMA, making higher highs)
- Key level: Approaching 1-hour resistance from 3 days ago (major level)
- Market regime: Trending, not choppy
- Bias: Long preferred, but caution near resistance
- PredictIndicators.ai forecast: Bullish Stochastics cross in 8-10 bars (high confidence)
- Price action: Pulling back to 15-min support (confluent with 1-hour demand zone)
- Pattern: Bull flag forming (continuation pattern)
- Setup: Valid per her rules (trend pullback + predictive signal)
- Entry: Limit order at 15-min support confluence
- Stop: Below 5-minute swing low (clean, 8 ticks risk)
- Target: 1-hour resistance minus 2 ticks (16 ticks reward = 2:1)
- Execution: Order fills, position active
Trade management as it unfolds:

Bar 1-3: Price holds above entry, 5-min shows strength
Bar 4-6: PredictIndicators.ai 15-min forecast updates - Stochastics cross confirmed,
         but 1-hour forecast shows potential bearish DM cross in 15 bars
Bar 7-10: Price approaches 1-hour resistance, momentum slowing
Bar 11: Target 1 hit (1:1 reward), Jennifer takes 50% off, moves stop to breakeven
Bar 12-14: Price chops at resistance, 1-hour bearish forecast building
Bar 15: Price reverses, stop triggered on remainder

Result: +8 ticks (partial) + 0 ticks (stop) = +4 ticks net
Jennifer didn't hold hoping for breakout. She knew from 1-hour predictive forecast that resistance would likely hold. She took partial profits, protected capital, and exited before the reversal accelerates.
Multi-timeframe + predictive = informed management, not hope.
Adjust your three-timeframe stack based on style:
Note: Scalping requires fastest reaction. PredictIndicators.ai 30-bar forecasts on 1-minute give ~30 minutes of foresight—enough to plan entries before setups mature.
Most common retail style. PredictIndicators.ai excels here—30 bars on 5-minute = ~2.5 hours of forecast, covering most day-trading sessions.
Longer holds. PredictIndicators.ai 30 bars on 1-hour = 30 hours of forecast (multi-day). Aligns well with swing holding periods.
Patient style. PredictIndicators.ai 30 bars on daily = 30 days of forecast (full month). Supports position-level planning.
All styles work across PredictIndicators.ai platforms: NinjaTrader 8, MT5, iPhone, iPad, Android, Mac app, web app. Your timeframe stack doesn't fragment when you switch devices.
Make this a pre-market ritual (10-15 minutes before session):
This routine takes 15 minutes pre-market + 5 minutes mid-session review. Prevents impulsive trades, ensures context, builds consistency.
Single-timeframe trading is like driving using only your rearview mirror. You see something, but you're missing the road ahead, the intersections, the hazards.
Multi-timeframe analysis gives you:
Tools like PredictIndicators.ai make this accessible: 30-bar forecasts on every timeframe, across every platform (NinjaTrader 8, MetaTrader 5, iPhone, iPad, Android, Mac app, web app). You're not guessing what's next—you're planning for it.
Three timeframes. Clear hierarchy. Predictive insight. Consistent process. That's how retail traders stop getting chopped and start trading with context.