Starting your trading journey? You're not alone. Every day, new traders sign up for charting platforms, stare at those colorful charts, and wonder: "Which indicators should I actually use?"
Here's the truth most won't tell you: you don't need 20 indicators. You need the right 3-5 indicators that work together, understand what they're telling you, and have the discipline to follow their signals.
I'm Robert, and I've spent over 25 years watching traders succeed and fail. The difference? Beginners who master a few core indicators consistently outperform those who chase every new tool. In this guide, I'll walk you through the best indicators for beginners—with exact setup instructions, real examples, and the mistakes to avoid.
💡 Quick Reality Check: No indicator predicts the future perfectly. The goal isn't perfection—it's finding high-probability setups and managing risk. Even the best indicators require discipline and proper risk management when used correctly.
Why Modern Charting Platforms for Beginner Traders?
Before we dive into specific indicators, let's talk about why modern charting platforms have become the go-to choice for retail traders worldwide:
- Accessible pricing—you can access most essential indicators on free or low-cost plans
- Clean, intuitive interface—no overwhelming menus or confusing workflows
- Works on every device—iPhone, iPad, Android, Mac, or web browser
- Active community—large community of traders sharing ideas and setups
- No software installation—everything runs in your browser
Whether you're trading stocks, forex, crypto, or futures, modern charting platforms give you the tools without the complexity. And here's something important: while technical analysis platforms excel at charting, tools like PredictIndicators.ai complement them by adding AI-powered forecasting across multiple platforms—including NinjaTrader, MetaTrader, iPhone, iPad, Android, Mac, and web apps. We'll talk more about how these tools work together later.
The 7 Best Trading Indicators for Beginners
These seven indicators consistently deliver the best balance of simplicity, reliability, and educational value for new traders. Let's break them down one by one.
1. Moving Average Convergence Divergence (MACD)
What it does: Shows trend direction, momentum, and potential reversal points—all in one indicator.
Why beginners love it: The MACD gives clear visual signals. When the blue line crosses above the orange line, that's typically bullish. When it crosses below, that's bearish. Simple.
📍 How to Add MACD on Your Charting Platform:
- Open any chart on your platform
- Click "Indicators" at the top of the screen (or press
/)
- Type "MACD" in the search box
- Click "Moving Average Convergence Divergence"
- It appears below your main chart with histogram bars
Default Settings (keep these): Fast Length: 12, Slow Length: 26, Signal Smoothing: 9
How to read it:
- Bullish crossover: MACD line (blue) crosses above Signal line (orange) → Consider long positions
- Bearish crossover: MACD line crosses below Signal line → Consider short positions
- Histogram: Green bars above zero = bullish momentum; Red bars below zero = bearish momentum
- Divergence: Price makes new highs but MACD doesn't? Potential reversal ahead
Pro Tip: MACD works best on 1-hour, 4-hour, and daily charts. Avoid using it on anything under 15 minutes—too much noise for beginners.
2. Relative Strength Index (RSI)
What it does: Measures whether an asset is overbought or oversold on a scale of 0-100.
Why beginners love it: RSI answers the critical question: "Is this price move exhausted, or does it have room to run?"
📍 How to Add RSI on Your Charting Platform:
- Click "Indicators" (or press
/)
- Search "RSI" or "Relative Strength Index"
- Click to add—it appears in a separate pane below your chart
Default Settings: Length: 14 (this is the industry standard—don't change it yet)
How to read it:
- Above 70: Overbought territory—price may pull back soon
- Below 30: Oversold territory—price may bounce soon
- 50 level: Above 50 = bullish bias; Below 50 = bearish bias
- Divergence: Price makes new high but RSI doesn't? Reversal warning
⚠️ Common Mistake: Don't sell immediately when RSI hits 70 or buy at 30. In strong trends, RSI can stay overbought or oversold for extended periods. Wait for RSI to actually turn back toward 50 before acting.
3. Bollinger Bands
What it does: Shows price volatility and potential support/resistance levels using standard deviations.
Why beginners love it: Bollinger Bands visually show when price is stretched too far from its average—perfect for spotting potential reversions.
📍 How to Add Bollinger Bands on Your Charting Platform:
- Click "Indicators"
- Search "Bollinger Bands"
- Add to chart—three bands appear overlaid on your price
Default Settings: Length: 20, Standard Deviation: 2
How to read it:
- Middle band: 20-period simple moving average (the "fair value" line)
- Upper band: 2 standard deviations above—price touching here is extended high
- Lower band: 2 standard deviations below—price touching here is extended low
- Squeeze: Bands tighten = low volatility, big move coming
- Expansion: Bands widen = high volatility, trend in progress
Beginner strategy: Buy when price touches the lower band AND RSI is below 30. Sell when price touches the upper band AND RSI is above 70. This combination filters out false signals.
4. Volume Profile Visible Range (VPVR)
What it does: Shows where the most trading volume occurred at specific price levels.
Why this matters: Price levels with heavy volume become future support or resistance. Think of it as a "footprint" of where institutions have been active.
📍 How to Add Volume Profile on Your Platform:
- Click "Indicators"
- Search "Volume Profile Visible Range" or "VPVR"
- Note: This feature may require a premium subscription on most platforms (worth it for serious traders)
- Add to chart—horizontal histogram appears showing volume at each price level
How to read it:
- High volume nodes (long bars): Strong support/resistance zones
- Low volume nodes (short bars): Price moves through these quickly
- Point of Control (POC): The price level with highest volume—major magnet for price
Beginner strategy: Enter trades near high volume nodes (support in uptrends, resistance in downtrends). These levels have institutional interest and tend to hold.
5. Exponential Moving Average (EMA)
What it does: Smooths price data to show trend direction, giving more weight to recent prices.
Why beginners love it: EMAs are objective trend filters. Price above EMA = uptrend. Price below EMA = downtrend. No guessing.
📍 How to Add EMA on Your Platform:
- Click "Indicators"
- Search "Moving Average Exponential"
- Add to chart—line appears overlaid on price
- Click on the EMA line → Settings → Add multiple EMAs for comparison
Recommended Settings for Beginners:
- 20-period EMA: Short-term trend (green line)
- 50-period EMA: Medium-term trend (blue line)
- 200-period EMA: Long-term trend (red line)
How to read it:
- Golden cross: 20 EMA crosses above 50 EMA → Bullish signal
- Death cross: 20 EMA crosses below 50 EMA → Bearish signal
- Price above 200 EMA: Long-term uptrend—look for buys
- Price below 200 EMA: Long-term downtrend—look for sells or stay out
6. ATR (Average True Range)
What it does: Measures market volatility—how much price typically moves in a given period.
Why this matters: ATR tells you where to place stop losses and take profits based on actual market behavior, not arbitrary levels.
📍 How to Add ATR on Your Platform:
- Click "Indicators"
- Search "Average True Range" or "ATR"
- Add to chart—appears as single line in separate pane
Default Settings: Length: 14
How to use it for risk management:
- Stop loss: Place stops 1.5-2x ATR away from entry
- Take profit: Target 2-3x ATR from entry
- Position size: Higher ATR = smaller position (more volatile markets need smaller size)
Example: If you're trading EURUSD and ATR reads 0.0050 (50 pips), place your stop loss 75-100 pips away. This gives the trade room to breathe without getting stopped out by normal volatility.
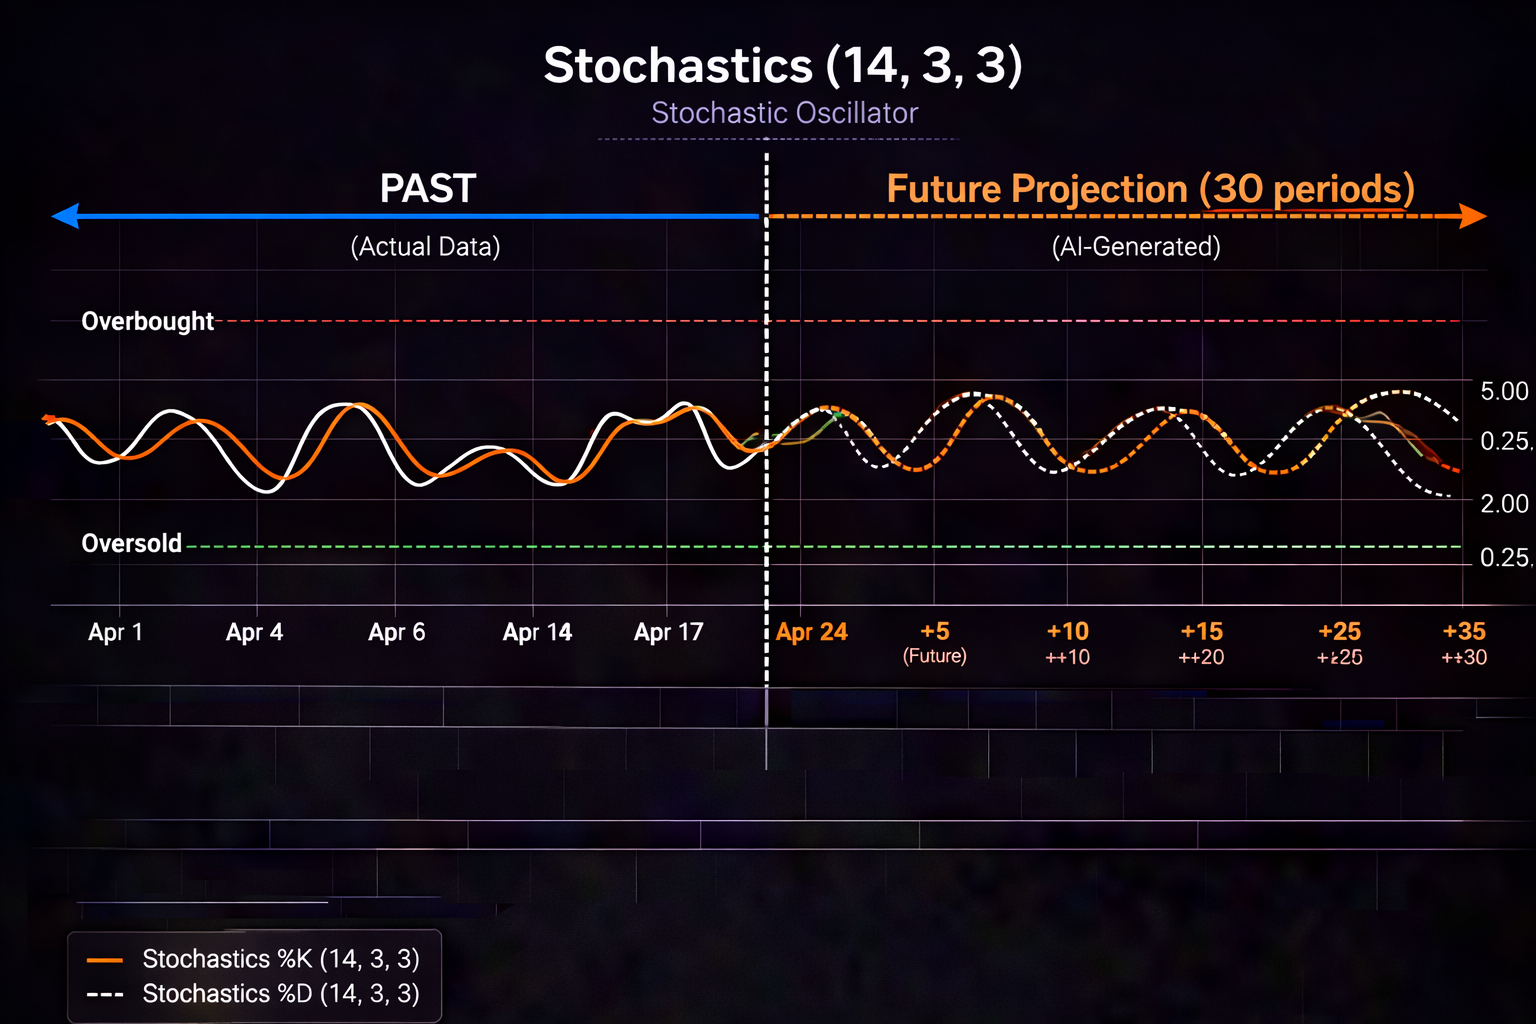
7. Stochastic Oscillator
What it does: Compares closing price to recent price range to identify overbought/oversold conditions.
Why beginners love it: Similar to RSI but often gives earlier signals, especially in ranging markets.
📍 How to Add Stochastic on Your Platform:
- Click "Indicators"
- Search "Stochastic" or "Stoch"
- Add to chart—two lines (%K and %D) appear in separate pane
Default Settings: %K Length: 14, %K Smoothing: 3, %D Smoothing: 3
How to read it:
- Above 80: Overbought—watch for bearish reversal
- Below 20: Oversold—watch for bullish reversal
- %K crosses above %D: Bullish signal
- %K crosses below %D: Bearish signal
Best used with: RSI for confirmation. If both Stochastic and RSI show oversold conditions, the reversal signal is stronger.
How to Combine Indicators Without Overloading Your Chart
Here's where most beginners fail: they add all seven indicators, create a colorful mess, and can't make decisions. Less is more.
I recommend this simple framework:
| Indicator Role |
Choose ONE |
Purpose |
| Trend Filter |
20/50/200 EMA |
Tells you the overall direction |
| Momentum |
MACD or RSI or Stochastic |
Shows if the move has strength |
| Volatility/Bands |
Bollinger Bands or ATR |
Defines risk and extension levels |
| Volume/Structure |
VPVR (if available) |
Shows where institutions are active |
Perfect beginner setup: 20 EMA + 50 EMA + MACD + RSI + ATR
This gives you trend direction (EMAs), momentum confirmation (MACD + RSI), and risk management (ATR). Five indicators max. Anything more is noise.
Step-by-Step: Your First Charting Setup
🚀 Complete Setup Guide (15 Minutes)
- Create your account on your chosen charting platform (or download the app)
- Open a chart—search for any symbol (AAPL, EURUSD, BTCUSD, etc.)
- Set your timeframe—Start with 1-hour or 4-hour charts (avoid anything under 15 minutes as a beginner)
- Add your indicators:
- Add 20 EMA (set color to green)
- Add 50 EMA (set color to blue)
- Add MACD (default settings)
- Add RSI (default settings)
- Add ATR (default settings)
- Save your layout—Use the save/export feature → Name it "Beginner Setup"
- Practice reading signals—Don't trade real money yet. Watch how price interacts with your indicators for at least 2 weeks
💡 Mobile Setup: The same indicators work identically on iPhone, iPad, and Android apps. PredictIndicators.ai also works across all these mobile platforms plus Mac and web if you want AI-powered forecasting to complement your technical analysis. The key is consistency—use the same setup on every device.
Real Trading Examples: Putting It All Together
Let's walk through two real scenarios so you can see how these indicators work together.
Example 1: Bullish Setup on Daily Chart
Asset: Apple (AAPL)
Timeframe: Daily
What you see:
- ✓ Price is above both 20 EMA and 50 EMA (uptrend confirmed)
- ✓ 20 EMA just crossed above 50 EMA (golden cross)
- ✓ MACD line crossed above Signal line (bullish momentum)
- ✓ RSI is at 55 and rising (not yet overbought)
- ✓ Price pulled back to the 20 EMA (support test)
- ✓ ATR reads $3.50 (use this for stop placement)
Action: This is a high-probability long setup.
- Entry: At current price or slight pullback to 20 EMA
- Stop loss: 2x ATR below entry = $7.00
- Target: 3x ATR above entry = $10.50
- Risk-Reward: 1:1.5 (acceptable)
Example 2: Bearish Setup on 4-Hour Chart
Asset: EUR/USD
Timeframe: 4-Hour
What you see:
- ✓ Price is below 20 EMA and 50 EMA (downtrend)
- ✓ Price rallied to touch the upper Bollinger Band (extension)
- ✓ RSI hit 72 and is turning down (overbought reversal)
- ✓ MACD histogram is shrinking (momentum fading)
- ✓ Stochastic crossed bearishly below %D line
Action: High-probability short opportunity.
- Entry: At current price or slight rally to 20 EMA
- Stop loss: Above the swing high that touched Bollinger upper band
- Target: Previous low or lower Bollinger Band
Performance Data: What Beginners Can Actually Expect
Let's be brutally honest about what you can achieve with these indicators.
Based on trading data analysis from beginner traders using indicator-based strategies, here's what the numbers typically show:
| Metric |
First 3 Months |
6-12 Months |
1+ Years |
| Win Rate |
~50% |
55-60% |
60%+ |
| Average Risk-Reward |
1:1 |
1:1.5 |
1:2+ |
| Profitable Traders |
10-15% |
30-40% |
50%+ |
Key insight: The traders who succeeded weren't using better indicators. They were using the same indicators with better discipline:
- ✓ They waited for multiple confirmations (not just one signal)
- ✓ They used ATR-based stops (not arbitrary levels)
- ✓ They traded with the trend (EMAs told them which way)
- ✓ They kept detailed journals (reviewed every week)
- ✓ They stayed consistent (same setup, every time)
The indicators don't make you profitable. You make yourself profitable by using indicators consistently and managing risk properly.
Common Beginner Mistakes (And How to Avoid Them)
Here are the five mistakes I see repeatedly—and exactly how to fix them:
Mistake #1: Changing Settings Constantly
You try 12-period RSI, then 14, then 10. You adjust MACD to 8-17-9, then back to 12-26-9. Stop it. The default settings work because they're widely watched across the trading community. They become self-fulfilling signals.
Fix: Use default settings for 6 months minimum. Master them before experimenting.
Mistake #2: Trading Against the Trend
Price is below all EMAs (downtrend), but you buy because RSI is oversold. This is "catching a falling knife."
Fix: Only take signals in the direction of the trend. In uptrends, look for buy setups. In downtrends, look for sell setups or stay out.
Mistake #3: Ignoring Risk Management
You risk 10% of your account on one trade because "the setup looks perfect."
Fix: Never risk more than 1-2% per trade. Use ATR to set stops objectively. Survive first, profit second.
Mistake #4: Indicator Paralysis
You have 12 indicators on your chart and can't make a decision because they're all saying different things.
Fix: Maximum 5 indicators. If three agree, take the trade. If they conflict, stay out.
Mistake #5: Jumping Timeframes
You analyze the daily chart, then switch to 1-minute for entry, then check 4-hour for "confirmation."
Fix: Pick ONE primary timeframe (1-hour or 4-hour for beginners). Use one timeframe higher for trend context. Stick to it.
Beyond Basic Indicators: When to Add AI-Powered Tools
Once you've mastered these core indicators—give it at least 3-6 months of practice—you might wonder: "What's next?"
This is where tools like PredictIndicators.ai come into play. While charting platforms excel at traditional technical analysis, AI-powered forecasting can add another layer to your decision-making process.
Here's the key difference:
- Traditional indicators (MACD, RSI, etc.): Tell you what's happening now and what just happened
- AI forecasting tools: Analyze patterns to show probable future scenarios based on historical data
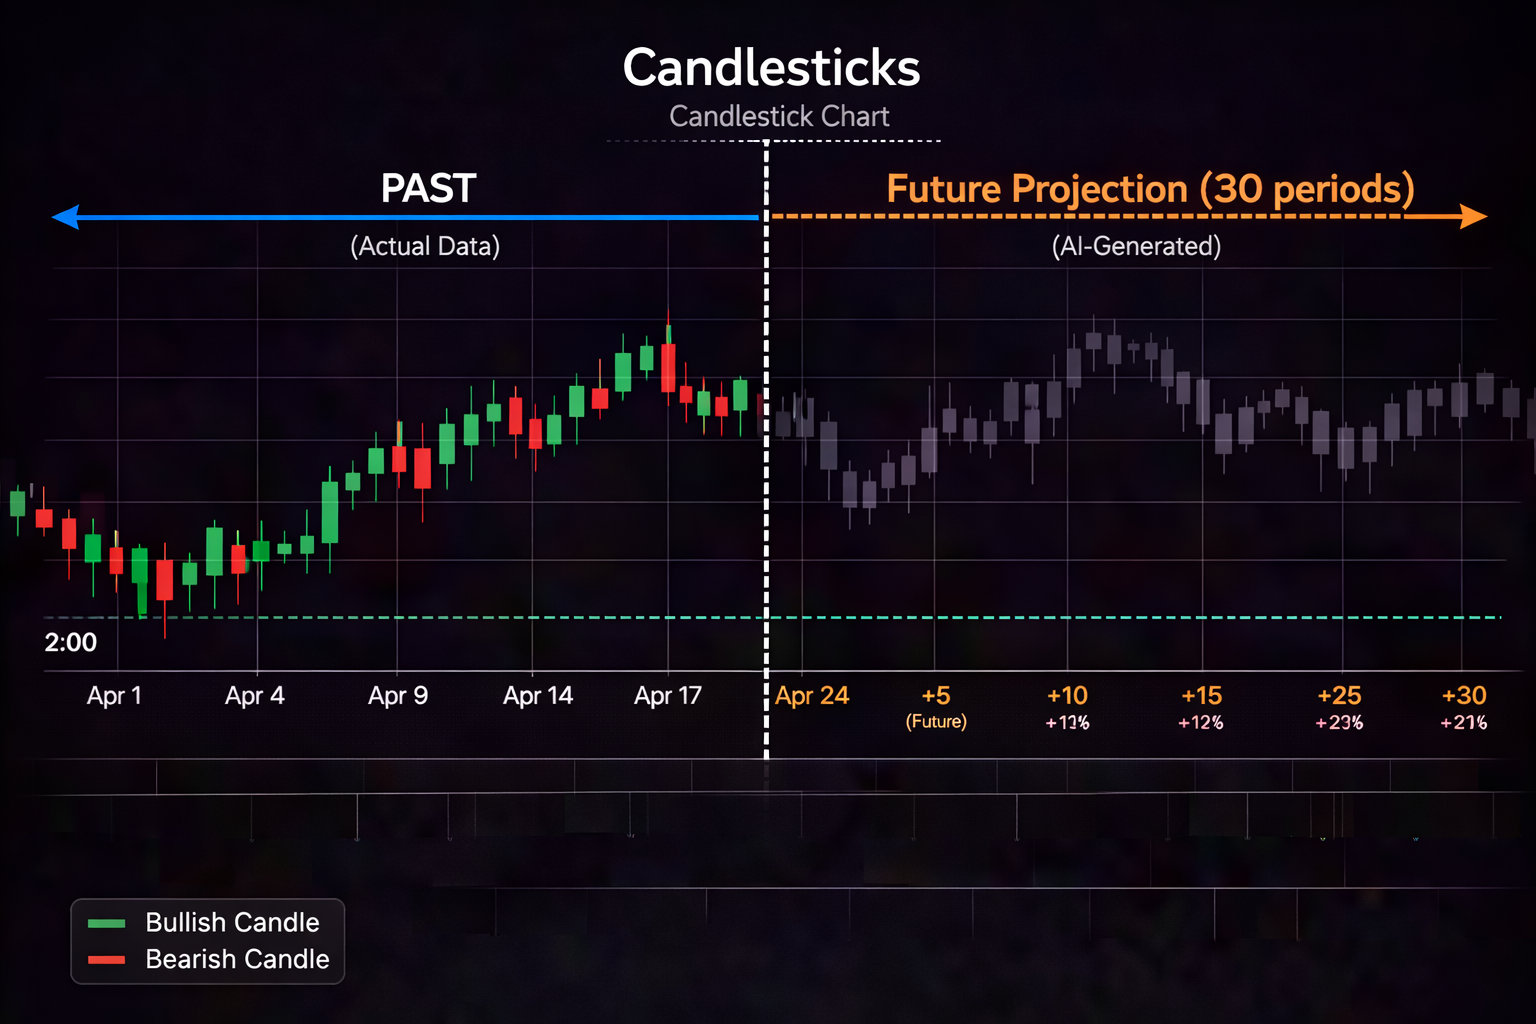
PredictIndicators.ai works across all the platforms you're already using—NinjaTrader 8, MetaTrader 5, iPhone, iPad, Android phone, Android tablet, Mac app, and web browser. The AI forecasts where your indicators (MACD, Stochastics, ATR, and more) are likely heading 30 bars into the future.
Smart approach: Use traditional indicators for your primary analysis. Use AI forecasting as a confirmation tool. If your MACD/RSI setup says "buy" and AI forecasting also shows bullish probability, you have stronger conviction. If they conflict, wait for better alignment.
Remember: no tool replaces discipline and risk management. AI is a supplement, not a substitute, for solid technical analysis skills.
Your 30-Day Practice Plan
Don't rush into live trading. Follow this progression:
Week 1-2: Observational Phase
- Set up your 5-indicator template on your charting platform
- Watch 3-5 assets daily (stocks, forex, or crypto)
- Don't trade—just observe how indicators behave
- Journal: "When MACD crossed up, did price actually rise?"
Week 3-4: Paper Trading Phase
- Use your platform's paper trading feature
- Take 2-3 trades per week maximum
- Force yourself to wait for 3+ indicator confirmations
- Journal every trade: entry reasoning, exit, lesson learned
Month 2+: Evaluate & Refine
- Review your journal: what patterns led to wins? What led to losses?
- If you're seeing consistent results on paper, consider small live positions
- Start with 0.5% risk per trade (yes, that small)
- Continue journaling religiously
Frequently Asked Questions
Q: Are trading indicators free?
A: Yes, most core indicators (MACD, RSI, Bollinger Bands, EMAs, ATR, Stochastic) are available on free plans across major platforms. Advanced features like Volume Profile may require a premium subscription, but they're not essential for beginners.
Q: Which timeframe should I use as a beginner?
A: Start with 1-hour or 4-hour charts. These give you enough signals to learn from without the noise of lower timeframes. Avoid anything under 15 minutes until you have 6+ months of experience.
Q: Can I use these indicators for crypto trading?
A: Absolutely. These indicators work identically across stocks, forex, crypto, and futures. The principles don't change—only the volatility does (adjust your ATR-based stops accordingly).
Q: Do I need PredictIndicators.ai or similar tools?
A: No. You can be consistently profitable with just the indicators available on free charting platforms if you master them. AI tools are optional enhancements, not requirements. Focus on fundamentals first.
Q: How long until I'm consistently profitable?
A: Realistic timeline: 6-12 months of dedicated practice. Anyone telling you otherwise is selling something. The traders who make it are the ones who stick with the process.
Ready to Take Your Trading Further?
You've got the indicator fundamentals down. Now it's about practice, discipline, and continuous learning.
Want to see how AI-powered forecasting can complement your technical analysis? Check out PredictIndicators.ai—available on NinjaTrader, MetaTrader, iPhone, iPad, Android, Mac, and web.
Start with the basics. Master them. Then layer on advanced tools when you're ready.
Final Thoughts: Keep It Simple
The best indicators for beginners aren't the most complex or the newest. They're the ones that have stood the test of time because they work:
- ✓ MACD for trend and momentum
- ✓ RSI for overbought/oversold levels
- ✓ Bollinger Bands for volatility and extension
- ✓ EMAs for trend direction
- ✓ ATR for risk management
- ✓ Stochastic for additional momentum confirmation
- ✓ Volume Profile for institutional levels (if available)
Master these. Trade them consistently. Manage your risk. Document everything. That's the real "secret" to trading success—there isn't one.
The indicators are tools. You are the trader. Invest in yourself first.
Happy trading,
Robert
Founder, PredictIndicators.ai
Related Resources