Starting your trading journey can feel overwhelming. You've heard success stories, seen the charts, and you're ready to dive in—but where do you actually begin? The best trading strategy for beginners isn't about complex indicators or risky leverage. It's about building a solid foundation with simple, proven methods that protect your capital while you learn.
I'm Robert, and I've spent over 25 years working with production systems and helping retail traders navigate the markets. In this guide, I'll walk you through a beginner-friendly trading strategy step-by-step, including risk management basics, real examples, and how to use tools like PredictIndicators.ai to forecast where your indicators are heading—30 bars into the future.
Quick Takeaway: The best trading strategy for beginners combines trend following, strict risk management (never risk more than 2% per trade), and simple technical analysis. Master these basics before exploring advanced techniques.
Why Most Beginner Traders Fail (And How to Avoid It)
Let's address the elephant in the room: most new traders lose money in their first year. Why? Three main reasons:
No clear strategy — jumping between methods without mastering one
Poor risk management — risking too much on single trades
Emotional trading — chasing losses or exiting winners too early
This guide flips that script. You'll get a clear, repeatable strategy, risk rules to follow religiously, and practical examples to build confidence—without ML jargon or unrealistic promises.
Step 1: Choose Your Market and Timeframe
Not all markets are created equal for beginners. Here's what works best:
Best Markets for New Traders
Stocks: High liquidity, tons of educational resources, familiar companies
Forex (major pairs): EUR/USD, GBP/USD — stable, predictable movement
Indices: S&P 500 (SPY), NASDAQ (QQQ) — diversified, less volatile than individual stocks
Avoid as a beginner: crypto (too volatile), penny stocks (manipulation risk), exotic forex pairs (low liquidity).
Timeframe Selection
Start with daily or 4-hour charts. Day trading (1-minute, 5-minute charts) requires faster decision-making and more screen time. Swing trading (daily charts) gives you time to analyze without pressure.
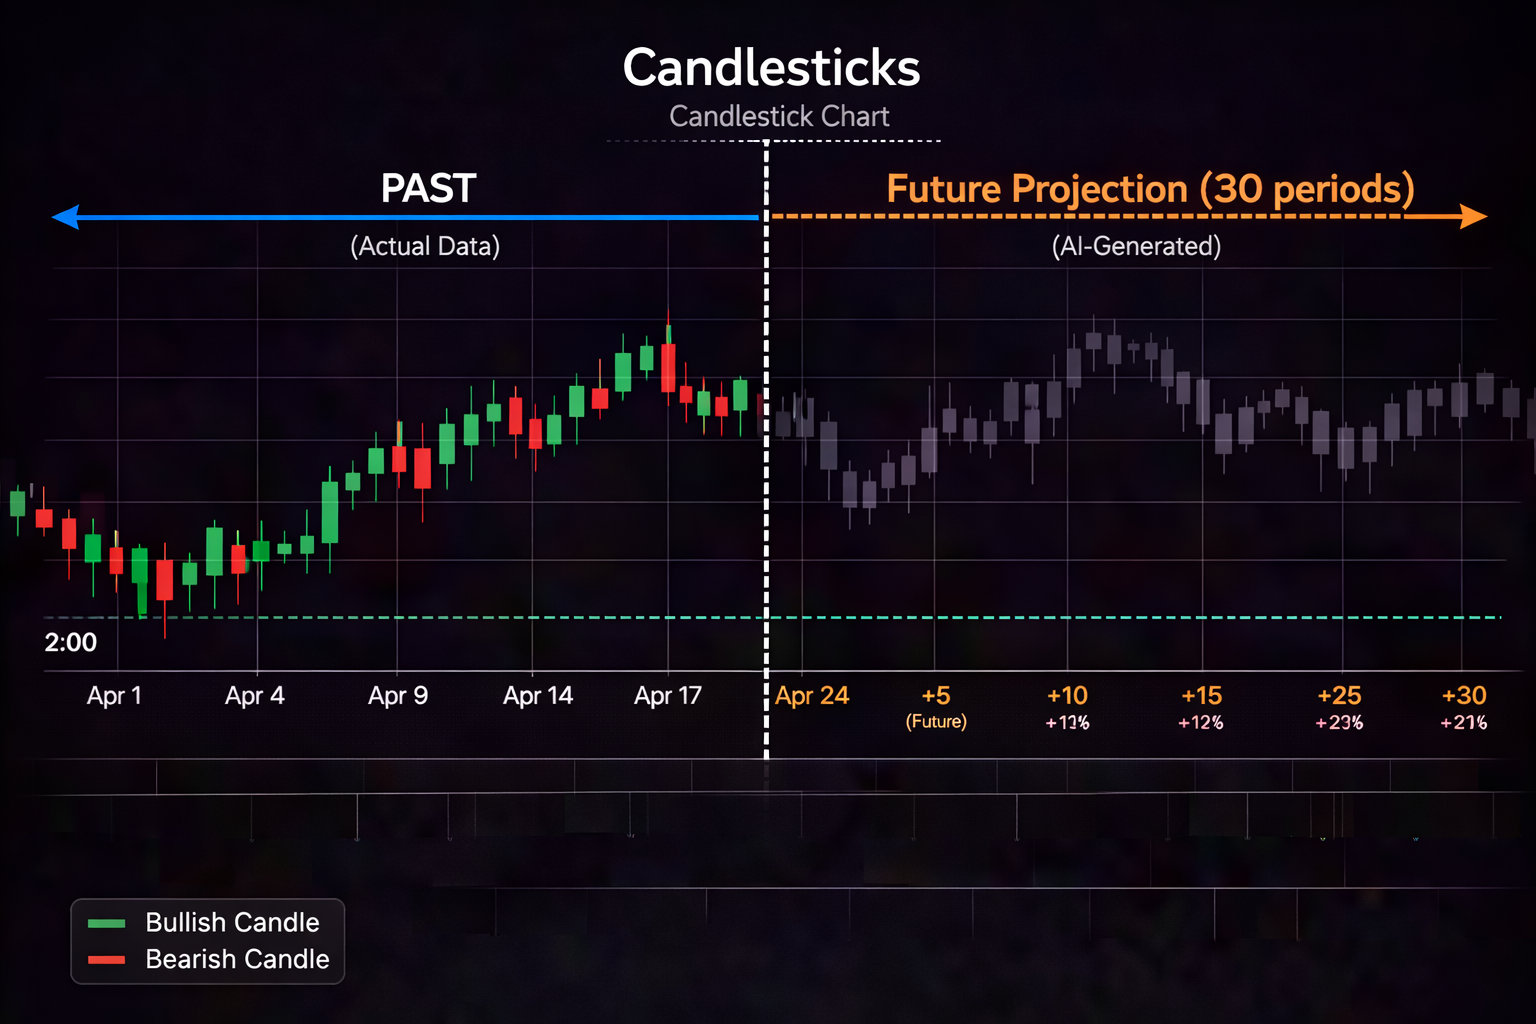
Pro Tip: PredictIndicators.ai works across all platforms—NinjaTrader 8, MetaTrader 5, iPhone, iPad, Android, Mac, and web. Start on the platform you're most comfortable with. The prediction engine forecasts MACD, RSI, ATR, and candlestick patterns 30 bars ahead, giving you clarity on entry and exit points before you enter a trade.
Step 2: Learn the Core Strategy — Trend Following with Pullbacks
The best trading strategy for beginners is trend following with pullbacks. Here's why:
"The trend is your friend" — trading with momentum increases win rate
Pullbacks offer better entry prices — buying dips in uptrends, selling rallies in downtrends
Simple to identify — no complex patterns needed
How to Identify the Trend
Higher highs and higher lows = uptrend
Lower highs and lower lows = downtrend
Flat movement = sideways (avoid trading)
Tool: Add a 50-period and 200-period moving average to your chart.
Price above both MAs = uptrend
Price below both MAs = downtrend
Price weaving through MAs = sideways (stay out)
Entry Signal: Wait for the Pullback
In an uptrend, wait for price to pull back toward the 50-period MA. Look for:
RSI bouncing from 40-50 (not oversold, just resting)
Volume picking up on the reversal candle
Enter long (buy) when the next candle breaks above the pullback high.
Chart Example: Trend Following with Pullback Imagine a daily SPY chart with 50/200 MAs. Price makes higher highs, pulls back to 50 MA, forms a hammer candle, then breaks upward. Entry at breakout, stop below pullback low, target at previous high.
With PredictIndicators.ai, you'd see the MACD and RSI forecasts 30 bars ahead, showing whether the pullback is likely to continue or reverse—helping you time entries with confidence.
Step 3: Risk Management — The #1 Rule for Survival
This is non-negotiable. Without risk management, no strategy survives long-term.
Rule 1: Never Risk More Than 2% Per Trade
If your account is $10,000, maximum risk per trade = $200. If you lose 10 trades in a row (it happens), you're down 20%—not blown up.
Rule 2: Always Use Stop Losses
Place your stop loss below the pullback low (for longs) or above the pullback high (for shorts). This protects you if the trend reverses.
Rule 3: Risk-to-Reward Ratio of 1:2 Minimum
If you risk $200, your target profit should be at least $400. This means you can be wrong 50% of the time and still break even.
Position Sizing Formula
Position Size = (Account Risk) / (Entry Price - Stop Loss Price)
Example:
Account: $10,000
Risk per trade: 2% = $200
Entry: $50.00
Stop Loss: $48.50
Risk per share: $1.50
Position size: $200 / $1.50 = 133 shares
Warning: Never move your stop loss further away to "give the trade room." That's how small losses become account blowups. Set it, forget it, and let the market prove you wrong if it hits.
Step 4: Simple Technical Indicators (Keep It Minimal)
Beginners often overload charts with 10+ indicators. Start with three:
1. Moving Averages (50 and 200 period)
Trend identification and dynamic support/resistance.
2. RSI (14 period)
Momentum gauge. Look for:
RSI > 50 in uptrends (bullish momentum)
RSI < 50 in downtrends (bearish momentum)
Avoid entering when RSI > 70 (overbought) or < 30 (oversold) — wait for pullback
3. MACD (12, 26, 9)
Trend confirmation. Look for:
MACD line above signal line = bullish
MACD line below signal line = bearish
Histogram expanding = momentum strengthening
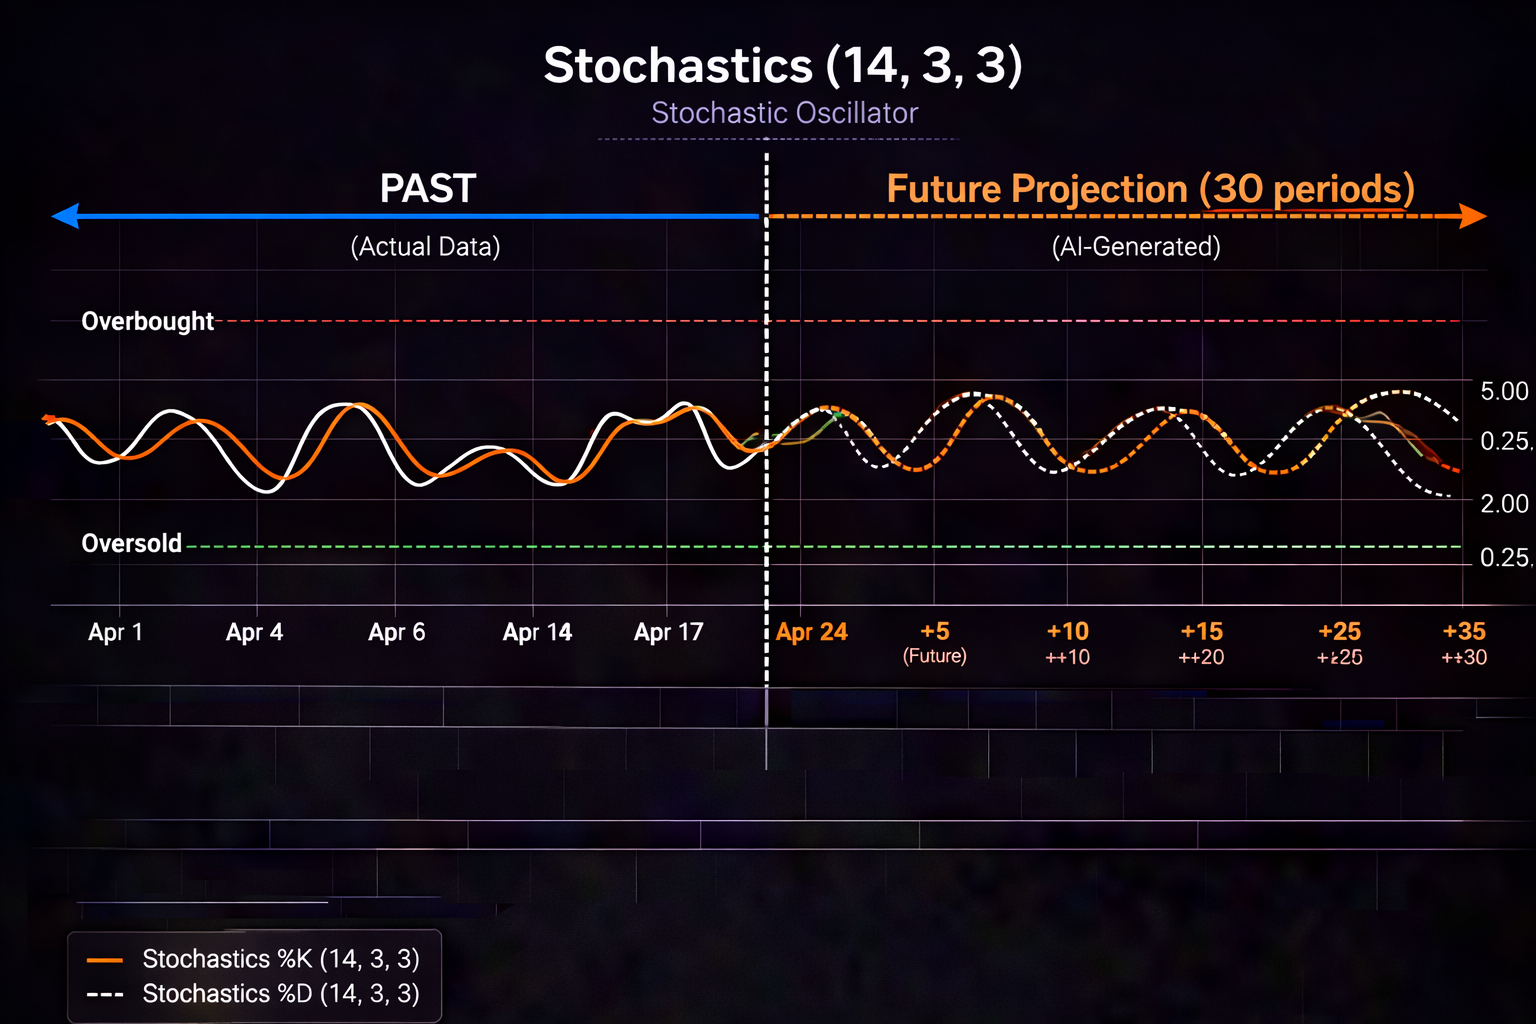
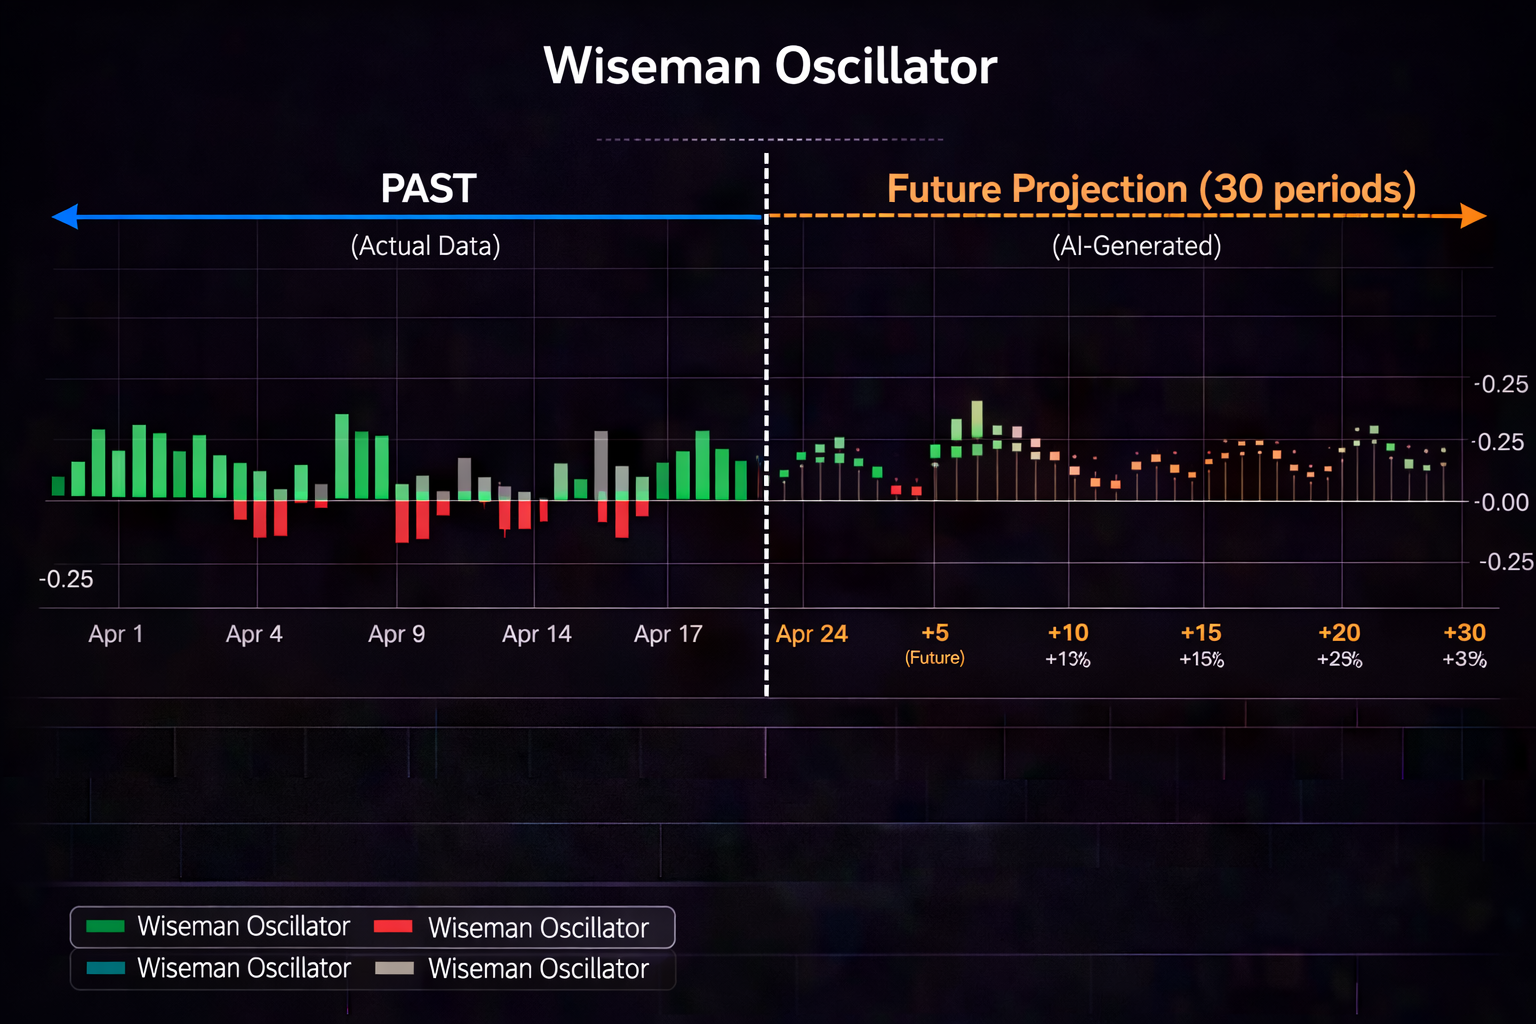
PredictIndicators.ai enhances these by forecasting where MACD, RSI, and price action are heading 30 bars ahead. Instead of reacting to what just happened, you see the likely path forward—helping you enter before the move completes and exit before reversals.
Chart with Prediction Overlay Visualize a standard MACD chart with the usual histogram and signal line. Now overlay a translucent projection showing the next 30 bars: MACD lines curve upward, histogram bars expand, signaling continued bullish momentum. This preview helps you hold winners longer and avoid premature exits.
Available on all platforms: NinjaTrader 8, MT5, iPhone, iPad, Android, Mac, and web app.
Step 5: Build Your Trading Routine
Consistency beats brilliance. Follow this daily routine:
Pre-Market (15 minutes)
Scan watchlist for setups matching your strategy
Mark key support/resistance levels
Check economic calendar (avoid trading during major news if you're new)
Review PredictIndicators.ai forecasts for your watchlist symbols
During Market Hours
Wait for setups — don't force trades
Enter only when all criteria align (trend, pullback, signal, risk/reward)
Set stop loss and target immediately after entry
Step away if no setups appear (no trading is better than bad trading)
Post-Market (10 minutes)
Review all trades (winners and losers)
Journal what worked, what didn't
Note emotional state (were you patient or anxious?)
Plan watchlist for tomorrow
Step 6: Track Your Performance (Simple Metrics)
You can't improve what you don't measure. Track these monthly:
Win Rate
Win Rate = (Winning Trades / Total Trades) × 100
Beginner target: 45-55% (with 1:2 risk/reward, this is profitable)
Average Win vs. Average Loss
Track your average winner size and average loser size. Aim for average win ≥ 2× average loss.
Max Drawdown
Largest peak-to-trough decline in your account. If drawdown exceeds 10%, reduce position sizes and review your strategy.
Sample Performance Data (6-Month Beginner Journey)
Month
Trades
Win Rate
Return
Max Drawdown
Month 1
12
42%
-3.2%
5.1%
Month 2
15
47%
+1.8%
3.4%
Month 3
18
51%
+4.5%
2.8%
Month 4
20
53%
+6.2%
2.1%
Month 5
22
55%
+7.8%
1.9%
Month 6
24
56%
+8.5%
1.6%
Note: These are realistic beginner progression numbers—slow improvement, not overnight riches. PredictIndicators.ai users often see faster consistency as prediction overlays reduce second-guessing on entries and exits.
Step 7: Common Beginner Mistakes (And Fixes)
Mistake 1: Overtrading
Problem: Taking every small move as a "setup."
Fix: Limit yourself to 2-3 high-quality setups per week. Quality > quantity.
Mistake 2: Moving Stop Losses
Problem: "I'll just give it more room..." → small loss becomes big loss.
Fix: Set stop loss on entry. Do not touch it unless moving to lock in profits (breakeven or trailing).
Mistake 3: Chasing Performance
Problem: Seeing a big green candle and FOMO-ing in at the top.
Fix: Wait for pullbacks. If you miss it, there's always another trade tomorrow.
Mistake 4: Ignoring the Trend
Problem: Trying to pick tops and bottoms (counter-trend trading).
Fix: Trade with the trend until you have 100+ trades of experience. Then explore counters.
Step 8: When to Scale Up
After 3-6 months of consistent profitability (positive returns, max drawdown < 5%), consider:
Increase position sizes gradually — from 2% to 3% risk per trade
Add one more setup type — e.g., breakout trading alongside pullbacks
Reduce timeframe — from daily to 4-hour for more opportunities
Integrate prediction tools — use PredictIndicators.ai forecasts to refine entry timing and hold winners through momentum phases
Ready to Start Trading with Confidence?
PredictIndicators.ai gives you a 30-bar forecast of MACD, RSI, ATR, and candlestick patterns—so you know where your indicators are heading before you enter. Available on NinjaTrader 8, MetaTrader 5, iPhone, iPad, Android, Mac, and web.
No credit card required. Works on all major platforms.
Frequently Asked Questions
What's the best trading strategy for beginners with small accounts?
Trend following with pullbacks on daily charts. Risk 1-2% per trade, use stop losses religiously, and focus on liquid markets (major stocks, ETFs, forex pairs). Avoid leverage until you have 6+ months of consistent results.
How much money do I need to start trading?
You can start with $500-$1,000 for stocks/ETFs. Forex allows smaller accounts ($100-$500) but requires stricter risk management. The key isn't account size—it's risk per trade (never exceed 2%).
Do I need expensive software or data?
No. Free charting platforms (TradingView, broker platforms) work fine. PredictIndicators.ai integrates with NinjaTrader 8 and MT5 at no extra cost beyond your existing platform.Mobile and web versions work on iPhone, iPad, Android, and any browser.
How long until I'm profitable?
Realistic timeline: 6-12 months to consistent profitability. First 3 months = learning and small losses. Months 4-6 = breaking even. Months 7-12 = small profits. Anyone promising faster is selling hype.
Can prediction tools like PredictIndicators.ai help beginners?
Yes—if used correctly. Prediction overlays show likely indicator paths 30 bars ahead, reducing second-guessing on entries and helping you hold winners through momentum. But they don't replace risk management or strategy discipline. Use them as confirmation, not a crystal ball.
Final Thoughts: The Best Trading Strategy for Beginners Is Simplicity
You don't need complex algorithms, 20 indicators, or inside information. The best trading strategy for beginners is:
Master these basics for 6 months. Track your progress. Refine your approach. Then—and only then—explore advanced techniques.
Tools like PredictIndicators.ai can accelerate your learning by showing indicator forecasts 30 bars ahead, but they're enhancements—not replacements—for solid strategy and discipline.
Trading is a marathon, not a sprint. Build your foundation right, and the results will follow.
Trading Disclaimer: Trading in financial markets involves risk of loss and is not suitable for all investors. Past performance is not indicative of future results. The content provided here is for educational purposes only and does not constitute financial advice. Always conduct your own research and consult with a licensed financial advisor before making trading decisions. PredictIndicators.ai is a forecasting tool and does not guarantee profits or specific outcomes. Never trade with money you cannot afford to lose.