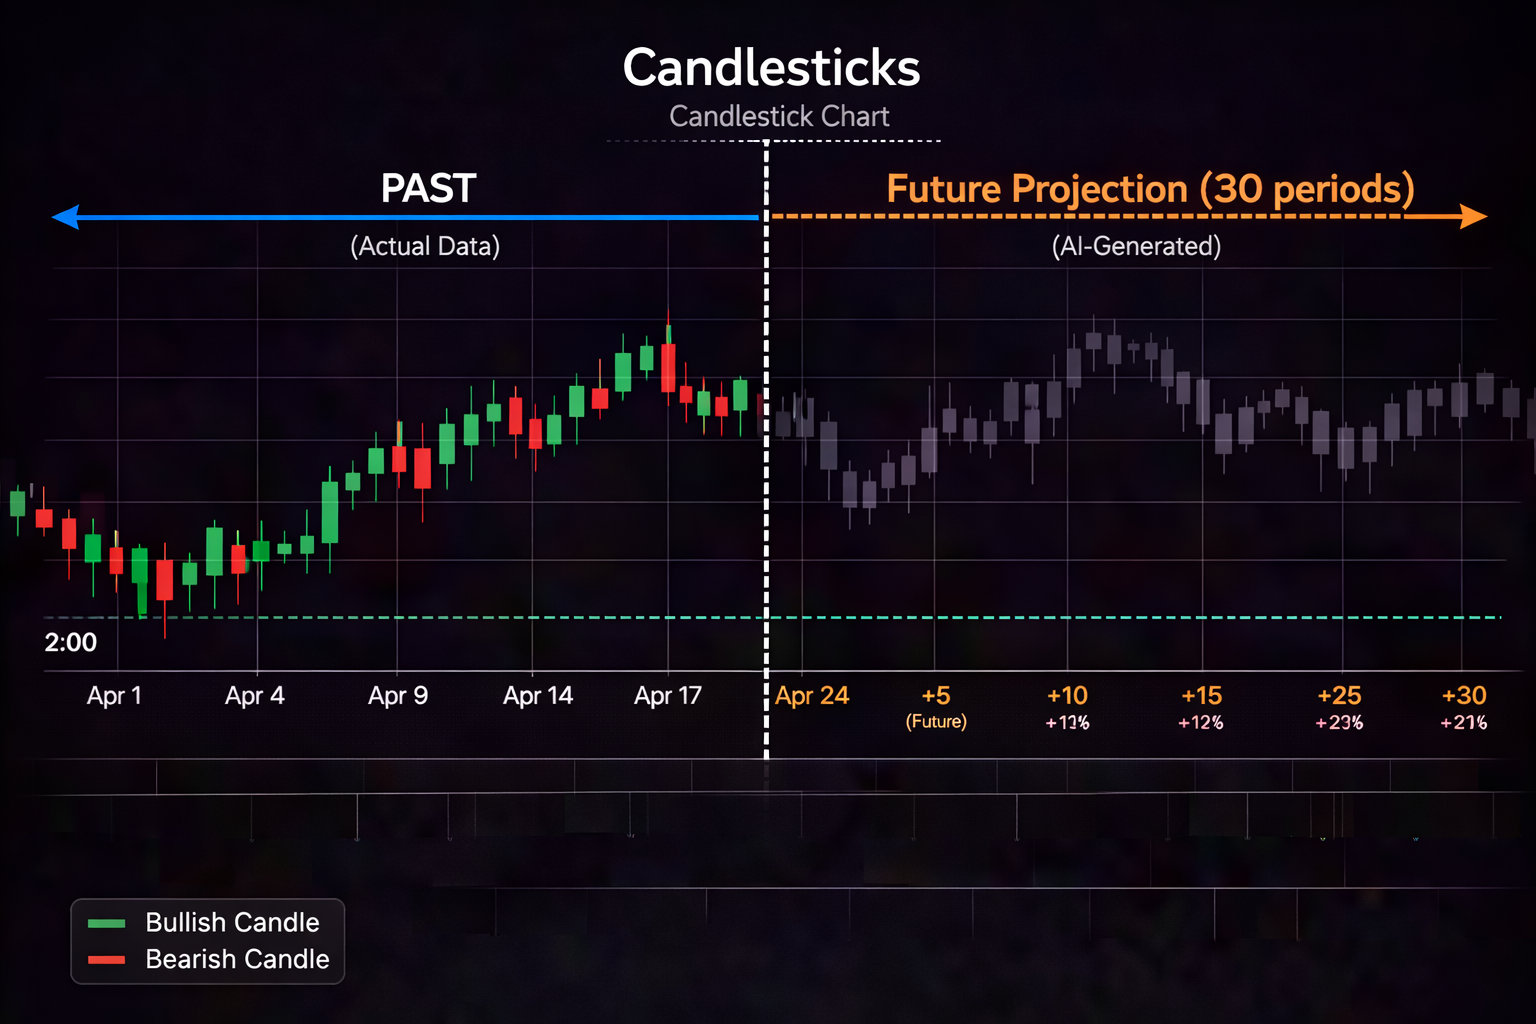

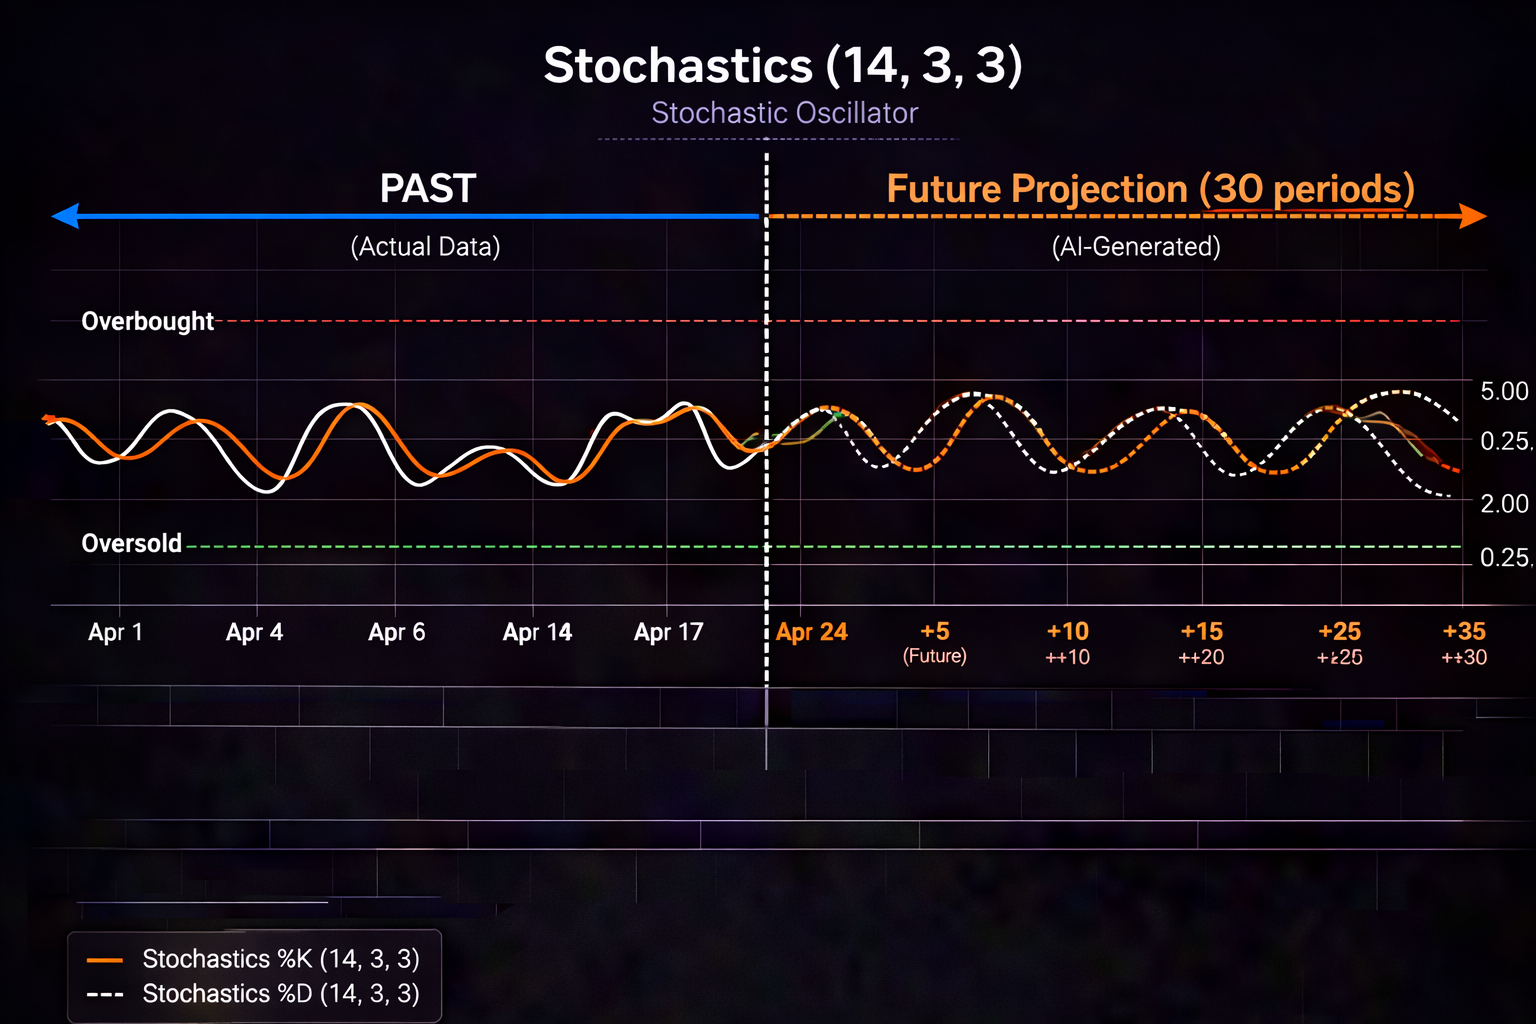


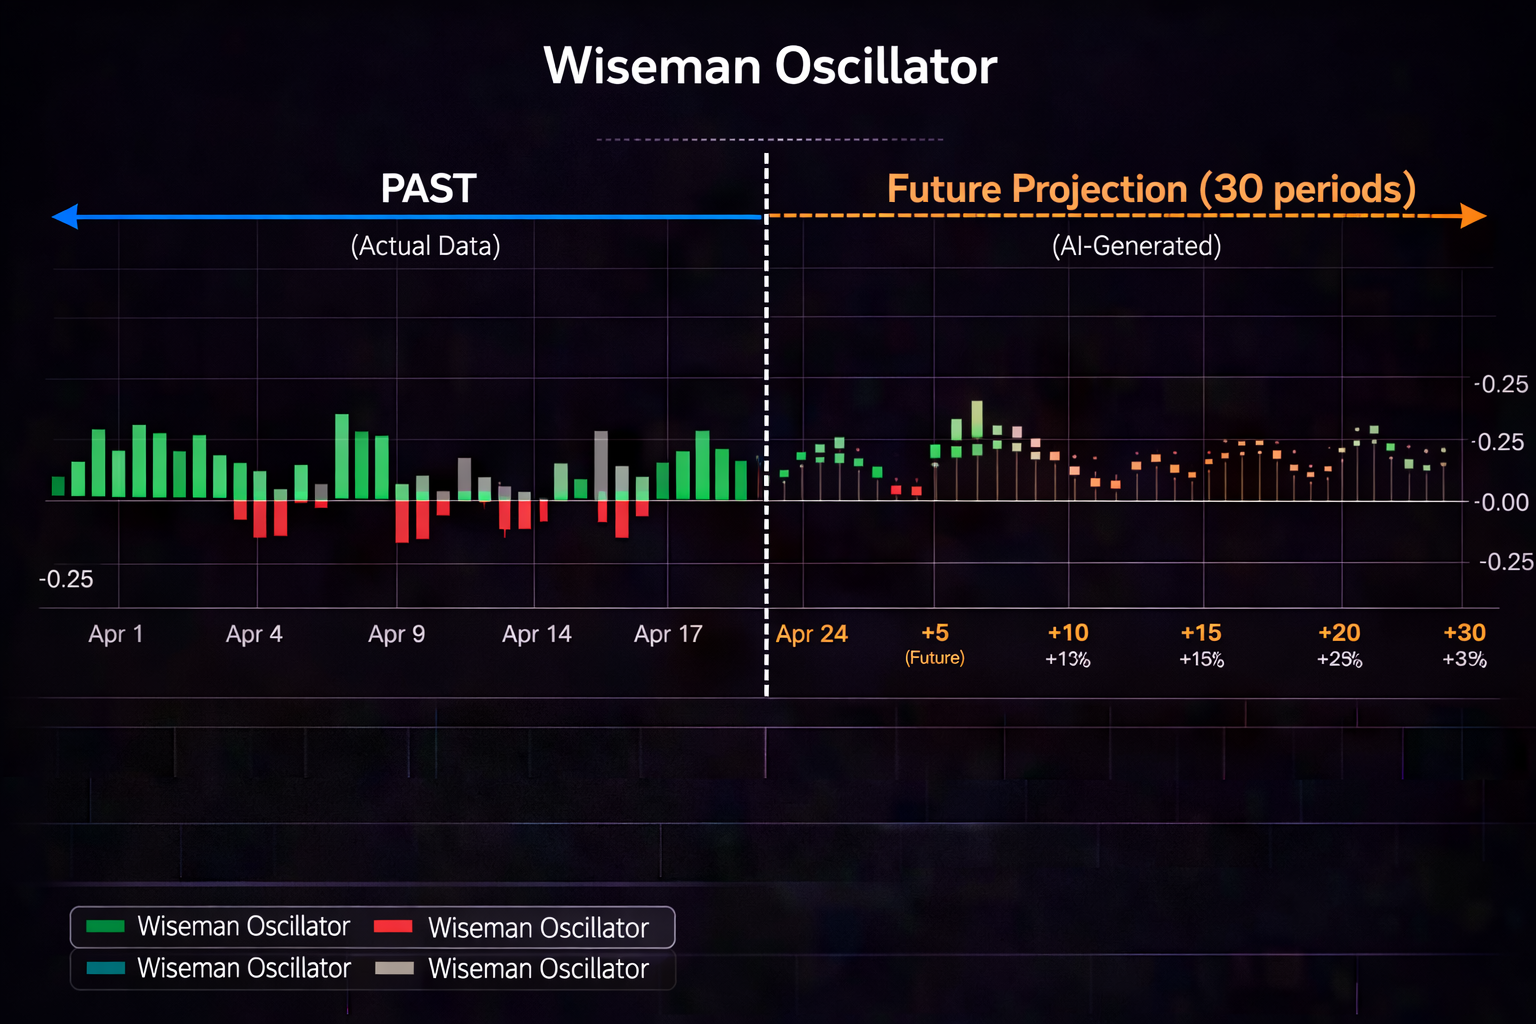
If you're searching for the best swing trading strategy indicators, you're probably overwhelmed by conflicting advice. YouTube gurus promise instant riches with "secret" indicators. Forums debate complex algorithms. Meanwhile, you're just trying to figure out which tools actually work for swing trading.
Here's the truth: you don't need exotic indicators or PhD-level math. The most successful swing traders use a handful of simple, time-tested tools—MACD, Stochastics, and ATR—and they master them through repetition and discipline.
In this guide, you'll learn:
- The 3 best swing trading indicators for beginners (and why simpler is better)
- Step-by-step setups for each indicator with real chart examples
- How to combine indicators for stronger trade confirmation
- Risk management basics every beginner must know
- How PredictIndicators.ai adds predictive power to these classic indicators across all platforms
Whether you're trading stocks, forex, or futures—and whether you're on NinjaTrader, MetaTrader 5, iPhone, or web—these strategies work. Let's dive in.
- MACD swing trading setup (beginner-friendly entry/exit rules)
- Stochastics overbought/oversold strategy with real examples
- ATR for position sizing and stop-loss placement
- How to layer all three indicators for high-probability setups
- Risk management rules to protect your capital
Why These Three Indicators?
Before we get into setups, let's address why MACD, Stochastics, and ATR earned their reputation as the best swing trading strategy indicators for beginners:
MACD (Moving Average Convergence Divergence)
What it does: Shows trend direction and momentum shifts
Why beginners love it: Clear visual signals (crossovers), works on all timeframes, and doesn't repaint or change after the bar closes
Best for: Identifying trend changes and momentum confirmation
Stochastics
What it does: Measures whether price is overbought (too high) or oversold (too low)
Why beginners love it: Simple 0-100 scale, clear reversal zones at 80 and 20
Best for: Spotting potential reversal points in ranging markets
ATR (Average True Range)
What it does: Measures market volatility—how much price typically moves in a given period
Why beginners love it: Takes the guesswork out of stop-loss placement and position sizing
Best for: Risk management, not trade entries
MACD Swing Trading Setup: Step-by-Step
The MACD is the foundation of many swing trading strategies. Here's how to use it properly:
Default Settings (Start Here)
- Fast Length: 12
- Slow Length: 26
- Signal Smoothing: 9
These are the standard settings for a reason—they work. Don't tweak them until you've mastered the basics.
📌 MACD Bullish Entry Setup
- Wait for the MACD line (blue) to cross ABOVE the signal line (orange)
This is your momentum shift signal - Confirm the histogram (bars) are increasing
Rising bars = strengthening momentum - Check that the crossover happens below the zero line
Crossovers below zero have more room to run - Enter on the next candle's open
Don't chase—wait for confirmation
📌 MACD Bearish Entry Setup
- Wait for the MACD line to cross BELOW the signal line
- Confirm histogram bars are decreasing (turning negative)
- Check that crossover happens above the zero line
- Enter short on next candle's open
MACD Exit Strategy
Knowing when to exit is more important than knowing when to enter:
- Take profit: When MACD line shows divergence (price makes higher high, MACD makes lower high)
- Stop loss: Place 1.5x ATR below your entry (we'll cover ATR positioning shortly)
- Trailing exit: When MACD crosses back against your position, exit immediately
March 2026: AAPL consolidating around $170. MACD crosses bullish below zero line at $172. Histogram bars increase for 5 consecutive days. Entry at $173 stop-loss at $168 (1.5x ATR). Price rallies to $182 over 12 days. MACD shows bearish divergence at $182—exit signal. Result: +$9 per share (5.2% gain in 12 days).
Stochastics Swing Trading Setup: Step-by-Step
Stochastics excels in ranging markets where price bounces between support and resistance. This is where many beginners struggle—trend indicators like MACD give false signals in choppy conditions. Stochastics thrives there.
Default Settings
- %K Period: 14
- %D Period: 3
- Smoothing: 3
📌 Stochastics Oversold Entry (Long)
- Wait for %K line to drop BELOW 20
This signals oversold conditions - Watch for %K to cross back ABOVE %D line
This is your momentum reversal signal - Confirm both lines are rising
Both should be pointing up after the cross - Enter when %K crosses ABOVE 20
Wait for confirmation—it's leaving oversold territory
📌 Stochastics Overbought Entry (Short)
- Wait for %K line to rise ABOVE 80
This signals overbought conditions - Watch for %K to cross BELOW %D line
- Confirm both lines are falling
- Enter when %K crosses BELOW 80
Stochastics Exit Strategy
- Take profit: When %K reaches the opposite zone (from 20 to 80, or from 80 to 20)
- Stop loss: 1.5x ATR beyond recent swing high/low
- Emergency exit: If %K reverses back into the zone you just exited, get out immediately
February 2026: EUR/USD ranging between 1.0850 and 1.0950. Stochastics drops to 15 (oversold). %K crosses above %D at 18. Both lines rise. Entry long at 1.0865 when %K crosses above 20. Price bounces to 1.0940 over 6 days. %K reaches 82 (overbought)—exit signal. Result: +75 pips in 6 days.
When NOT to Use Stochastics
Stochastics fails in strong trending markets. If price is making consecutive higher highs (uptrend) or lower lows (downtrend), Stochastics will stay overbought or oversold for extended periods, giving premature reversal signals.
Rule of thumb: Use Stochastics in ranging markets. Use MACD in trending markets. When in doubt, check both.
ATR for Risk Management: The Beginner's Safety Net
Here's the uncomfortable truth: most beginners blow up their accounts not because they pick bad trades, but because they size positions incorrectly. ATR solves this.
What ATR Actually Measures
ATR doesn't tell you direction—it tells you how much price typically moves. If ES futures have an ATR of 25 points on the daily chart, expect roughly 25 points of range per day (sometimes more, sometimes less, but 25 is the average).
Default Settings
- ATR Period: 14 (standard)
📌 Using ATR for Stop-Loss Placement
- Calculate your ATR value
Example: ATR = 2.50 on a stock trading at $150 - Multiply by 1.5 for swing trades
2.50 × 1.5 = 3.75 - Place stop-loss 1.5x ATR below entry (for longs)
Entry at $150, stop at $146.25 - For shorts, place stop 1.5x ATR above entry
Entry at $150, stop at $153.75
📌 Using ATR for Position Sizing
This is critical. Most beginners risk too much per trade. Here's the proper method:
- Determine your risk per trade
Example: $500 per trade (1% of $50,000 account) - Calculate stop distance in dollars
Entry $150, stop $146.25 = $3.75 risk per share - Divide risk per trade by risk per share
$500 ÷ $3.75 = 133 shares - Buy 133 shares
If stopped out, you lose exactly $500
Account size: $25,000
Risk per trade: 1% = $250
Stock: NVDA at $875
ATR: $18.50
Stop distance: 1.5 × $18.50 = $27.75
Stop price: $875 - $27.75 = $847.25
Shares to buy: $250 ÷ $27.75 = 9 shares
Total capital deployed: 9 × $875 = $7,875 (31% of account)
If stopped out: 9 × $27.75 = $249.75 loss (exactly 1%)
Combining All Three Indicators: The Ultimate Beginner Setup
Now for the magic: layering MACD, Stochastics, and ATR together creates a high-probability swing trading system. Here's the exact checklist:
📌 Complete Swing Trade Checklist (Long Example)
- MACD Check: Is MACD line above signal line? ✓ Yes (bullish momentum)
- Stochastics Check: Did %K just cross above %D from oversold (<20)? ✓ Yes (timing is good)
- Trend Check: Is price above 50-day moving average? ✓ Yes (trading with the trend)
- ATR Calculation: What's 1.5x ATR? Example: $18.50 × 1.5 = $27.75
- Entry: Enter at market on confirmation candle close
- Stop Loss: Entry price minus 1.5x ATR
- Position Size: (Risk per trade) ÷ (Stop distance) = shares to buy
- Take Profit Target: Previous resistance level OR when Stochastics reaches 80
Real Combined Example (TSLA Swing Trade)
- Price: $385, consolidating after earnings dip
- MACD: Crossed bullish 3 days ago, histogram rising ✓
- Stochastics: %K crossed above %D at 18, now at 25 and rising ✓
- 50-day MA: Price just crossed above $382 ✓
- ATR: $12.40
Entry: $387 (confirmation candle close)
Stop: $387 - (1.5 × $12.40) = $368.40
Risk per share: $18.60
Account: $40,000 (1% risk = $400)
Shares: $400 ÷ $18.60 = 21 shares
Target: $420 (previous resistance) OR Stochastics at 80
Outcome (14 days later):
Price rallied to $418. Stochastics hit 82—exit signal.
Profit: $418 - $387 = $31 per share
Total: 21 × $31 = $651 (1.6% account gain)
Risk Management Basics Every Beginner Must Know
You can have the best indicators in the world, but without risk management, you will blow up your account. Period. Here are the non-negotiable rules:
Rule 1: Never Risk More Than 1-2% Per Trade
If you have a $20,000 account, you should lose no more than $200-$400 on any single trade. Yes, this means small position sizes. Yes, this means slow growth. This is how you survive long enough to get good.
Rule 2: Always Use Stop Losses
Hope is not a strategy. Every trade must have a predetermined exit point where you admit you're wrong. ATR-based stops remove emotion from this decision.
Rule 3: Don't Add to Losing Positions
Beginners see a losing trade and think "I'll buy more at a better price." This is how small losses become account blowups. If the trade goes against you, your stop loss exits you. Period.
Rule 4: Keep a Trading Journal
Record every trade: entry reason, indicator readings, exit reason, outcome. Review monthly. You'll spot patterns in your mistakes—and your wins.
Rule 5: Start Small, Scale Slowly
First 20 trades: use half your normal position size. You're learning. Once you have 10 profitable trades out of 20, scale to full size.
Platform Flexibility: Where to Trade These Strategies
One reason MACD, Stochastics, and ATR are the best swing trading strategy indicators is that they work everywhere. PredictIndicators.ai brings these classic indicators to all platforms with predictive enhancements:
Desktop charting with full indicator suite
Forex and CFD trading with MT5 integration
Full analysis in your pocket
Tablet-optimized for detailed charting
Mobile access for Android traders
Native macOS desktop experience
Browser-based access from any device
Your charts sync across all devices. Set up your MACD/Stochastics/ATR analysis on NinjaTrader at your desk, then monitor your positions on iPhone during the day or iPad at night. Want to learn more about mobile trading? Check out our guide on the best AI trading app for iPhone.
How PredictIndicators.ai Enhances These Classic Indicators
MACD, Stochastics, and ATR are powerful on their own—but what if you could see where they're heading 30 bars into the future?
PredictIndicators.ai doesn't replace these indicators. It adds a predictive layer on top, showing you where MACD crossovers, Stochastics reversals, and ATR volatility expansions are likely to occur before they actually happen.
This isn't about replacing your analysis—it's about adding foresight to your existing strategy.
And because PredictIndicators.ai works on all platforms (NinjaTrader, MT5, iPhone, iPad, Android, Mac, and web), your predictive insights sync everywhere you trade.
Common Beginner Mistakes to Avoid
Mistake 1: Constantly Tweaking Indicator Settings
Beginners think there's a "perfect" setting they haven't discovered yet. There isn't. Default settings (12,26,9 for MACD; 14,3,3 for Stochastics; 14 for ATR) work because they've been tested for decades. Master the defaults first.
Mistake 2: Using Too Many Indicators
Your chart shouldn't look like a Christmas tree. MACD + Stochastics + ATR is plenty. Add more and you'll get analysis paralysis—conflicting signals that prevent you from pulling the trigger.
Mistake 3: Ignoring the Higher Timeframe
If you're trading on the 1-hour chart, check the daily trend first. Never swing trade against the higher timeframe trend. Daily uptrend = only look for long setups on lower timeframes.
Mistake 4: Overtrading
Not every day offers a A+ setup. Sometimes the best trade is no trade. Wait for your checklist to align perfectly. Impatient traders bleed capital through death by a thousand cuts.
Mistake 5: Not Backtesting
Before risking real money, test your setup on historical charts. Pick 50 past setups that match your criteria. How many would have been profitable? What was the average win/loss ratio? If you haven't backtested, you're gambling, not trading.
Practice Exercise: Your First 10 Trades
Here's your homework. Don't skip this.
- Open a demo account (or use paper trading on your platform)
- Pick ONE market (ES futures, AAPL stock, EUR/USD—just one)
- Trade ONLY the complete checklist setup (MACD + Stochastics + ATR risk management)
- Record every trade in a journal (entry reason, indicator values, exit reason, outcome)
- Take exactly 10 trades no more, no less
- Review after 10 trades:
- How many were profitable?
- What was your average win vs. average loss?
- Did you follow your rules on every trade?
- What patterns do you see in your losers?
Most beginners will have 5-7 profitable trades out of 10. That's normal. The goal isn't perfection—it's consistency and rule-following.
Frequently Asked Questions
Q: What timeframe is best for swing trading?
A: Daily and 4-hour charts are ideal for swing trading. Daily charts give you 3-10 day holds. 4-hour charts give you 1-3 day holds. Avoid anything below 1-hour for swing trading—that's day trading territory.
Q: How much capital do I need to start?
A: For stocks, you can start with $5,000-$10,000 and risk 1% per trade. For futures, ES requires about $25,000 minimum for proper risk management. Forex can be started with $2,000-$5,000 thanks to leverage (but leverage cuts both ways—be careful).
Q: Can I use these indicators for day trading instead?
A: Yes, but adjust your ATR multiplier. For day trading, use 1x ATR for stops instead of 1.5x (tighter stops). Also, focus on 5-minute and 15-minute charts instead of daily/4-hour.
Q: Do these indicators work on crypto?
A: Absolutely. Crypto is highly volatile, so use 2x ATR for stops instead of 1.5x. Also, crypto runs 24/7, so weekend gaps aren't a concern. The indicator signals work the same.
Q: How long should I hold swing trades?
A: Typical swing trades last 3-10 days. If a trade hasn't moved in your favor within 5 days, reconsider the thesis. Good setups should work relatively quickly. Dead money is opportunity cost.
Q: Should I trade multiple markets at once?
A: Not as a beginner. Master one market first. Once you're consistently profitable in one market (ES, or AAPL, or EUR/USD), then consider adding a second. Start concentrated, then diversify.
Ready to Add Predictive Power to Your Swing Trading?
PredictIndicators.ai enhances MACD, Stochastics, and ATR with 30-bar-ahead forecasting. See where your indicators are heading before the move happens.
Start Your Free TrialContinue Your Education:
The best swing trading strategy indicators aren't secret or complex. MACD, Stochastics, and ATR have worked for decades because they measure fundamental market dynamics: momentum, overbought/oversold conditions, and volatility. Master these three tools. Follow your checklist. Manage your risk. And remember—predictive technology like PredictIndicators.ai can enhance your edge, but discipline and consistency are what build long-term profitability.
Start with the 10-trade exercise. Keep your journal. Review your results. Adjust and repeat. The traders who win aren't the ones with the magic indicator—they're the ones who execute a simple plan flawlessly, trade after trade.