How AI Predicts RSI Reversals Before They Form
The RSI oscillator is one of the most widely used tools in trading — but it has a fatal flaw. By the time RSI crosses back out of overbought or oversold territory, the reversal has often already started. AI prediction changes that equation by forecasting RSI direction up to 30 bars ahead, giving you time to prepare before the signal becomes obvious to everyone else.
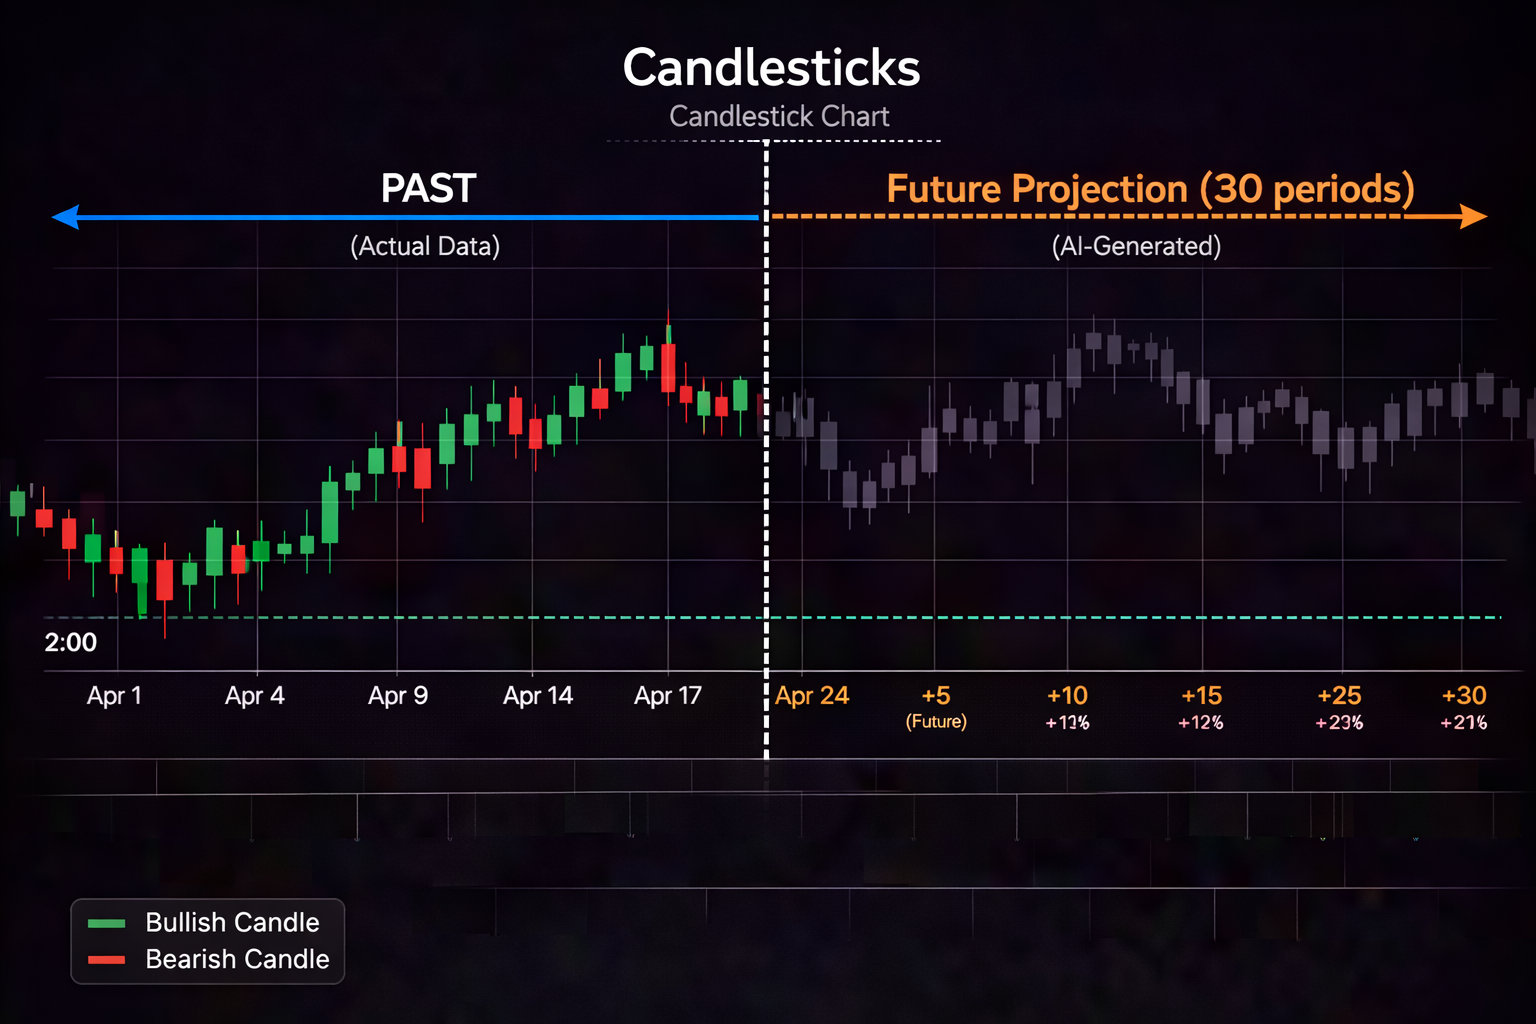

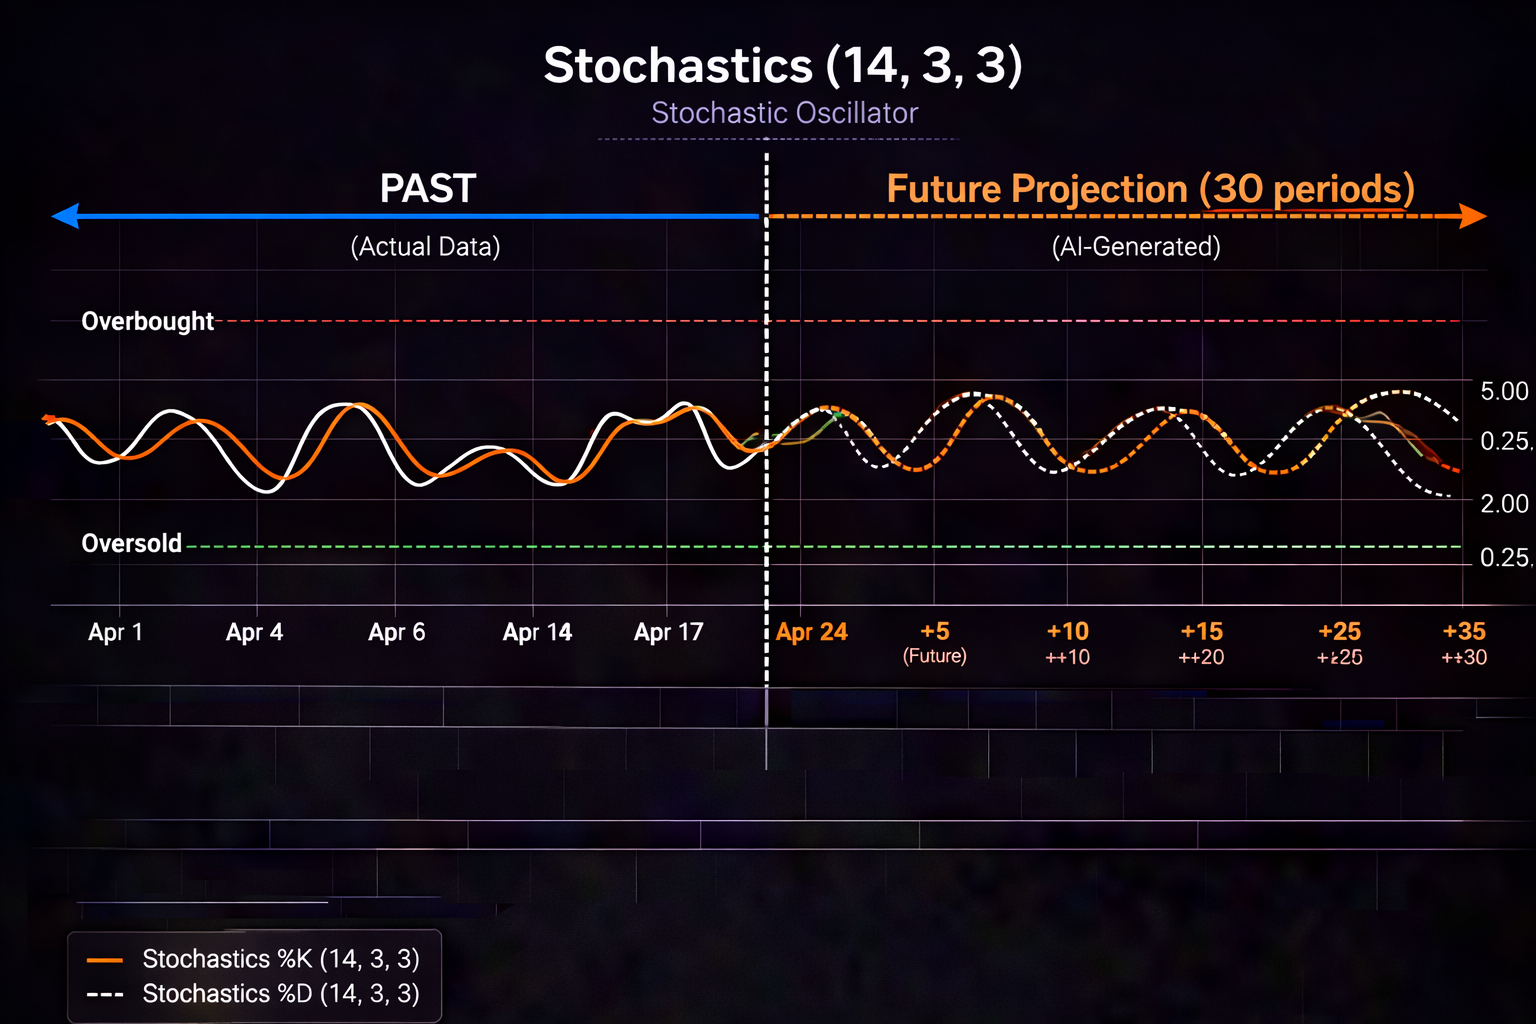


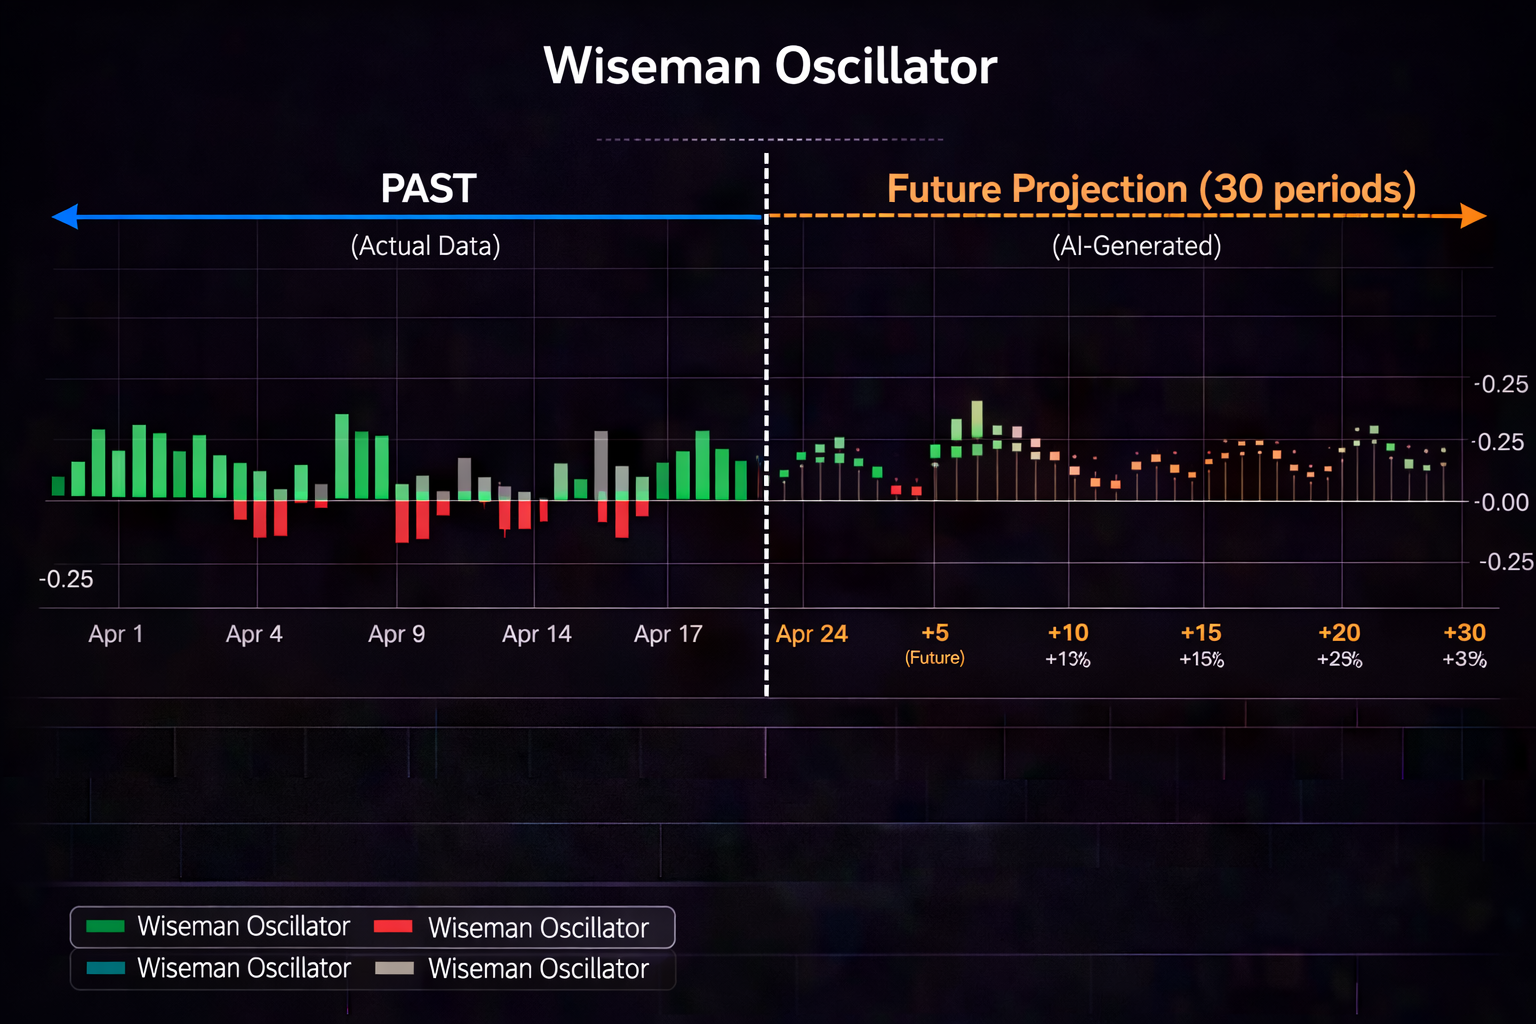
This guide explains how AI models forecast RSI behavior, why that matters for your entries and exits, and how PredictIndicators.ai brings predictive RSI analysis to NinjaTrader 8, MetaTrader 5, iPhone, iPad, Android, Mac, and web platforms.
Why Traditional RSI Signals Arrive Too Late
Relative Strength Index was designed to measure momentum — not to predict turning points. The standard RSI workflow looks like this:
- RSI climbs above 70 (overbought)
- Trader waits for RSI to cross back below 70
- By the time the cross prints, price has already moved
- Entry happens late, stop placement becomes awkward, risk/reward suffers
The same problem exists on the oversold side. Traders watch RSI drop below 30, wait for the cross back above 30, and enter after the best portion of the reversal has already occurred.
This lag is built into RSI's formula. It calculates based on past price action — typically 14 periods. That means RSI is inherently backward-looking. It tells you what momentum has done, not what it's likely to do.
What AI RSI Prediction Actually Does
AI prediction models analyze patterns in RSI behavior across thousands of historical bars. They learn how RSI typically behaves as it approaches extremes, how momentum tends to shift near key levels, and what early warning signs precede reversals.
Instead of showing you only the current RSI value, a predictive model forecasts where RSI is likely to be over the next 10, 20, or 30 bars. That forecast doesn't guarantee anything — but it gives you probabilistic information about whether momentum is likely to continue, flatten, or reverse.
Here's what that looks like in practice:
| Traditional RSI | Predictive RSI Analysis |
|---|---|
| Shows current RSI value (e.g., 72) | Shows current RSI + forecasted path over next 30 bars |
| Waits for cross below 70 to signal potential reversal | Identifies when RSI is likely to roll over before the cross happens |
| Reacts after momentum has already shifted | Prepares for momentum shift while it's still developing |
| Treats all overbought readings as equal | Distinguishes between overbought that will persist vs. overbought about to reverse |
The advantage isn't about entering earlier blindly. It's about having better information when price reaches a level where a reversal would actually matter.
How PredictIndicators.ai Forecasts RSI Behavior
PredictIndicators.ai applies machine learning models to RSI calculations across multiple timeframes. The system doesn't just look at RSI in isolation — it analyzes how RSI interacts with price structure, volume patterns, and other momentum indicators to generate forecasts.
Here's the workflow:
- Pattern recognition: The model identifies RSI patterns that have historically preceded reversals (e.g., RSI making lower highs while price makes higher highs = bearish divergence building).
- Multi-bar forecasting: Instead of predicting a single future RSI value, the model projects a path — showing how RSI is likely to evolve over the next 10-30 bars.
- Confidence scoring: Not all forecasts are equal. The model assigns confidence levels based on how closely current conditions match historical patterns that led to successful predictions.
- Cross-platform delivery: Forecasts appear on your desktop platform (NinjaTrader, MT5, Mac app) and sync to mobile devices (iPhone, iPad, Android) so you can monitor setups anywhere.
See RSI reversals forming before they're obvious
PredictIndicators.ai forecasts RSI behavior up to 30 bars ahead across all major trading platforms. Get early warning signals on desktop, mobile, tablet, or web.
Start Free TrialStep-by-Step: Trading RSI Reversals With AI Prediction
1. Mark Your Key Levels First
Before looking at any RSI forecast, identify the support, resistance, trendline, or session level where a reversal would be meaningful. AI prediction doesn't replace structure — it helps you time entries at structure more effectively.
2. Watch for RSI Approaching Extremes Near Your Levels
When price approaches your marked level and RSI is climbing toward 70 (or dropping toward 30), that's when predictive analysis becomes most valuable. The combination of price at a meaningful level + RSI at an extreme is where reversals often occur.
3. Check the RSI Forecast Path
Look at the predicted RSI trajectory over the next 10-30 bars. Is the forecast showing RSI continuing higher (momentum persisting) or starting to roll over (momentum fading)? A forecast showing RSI peaking and turning down while price is still climbing can warn you that a reversal is building.
4. Wait for Price Confirmation
The RSI forecast tells you where to pay attention — not when to enter blindly. Wait for price to show confirmation: rejection wicks, failure to make new highs/lows, or a break of short-term structure. The forecast gives you early warning; price action gives you the trigger.
5. Plan Your Invalidation Before Entering
Even with AI prediction, trades can fail. Your stop should be placed beyond the level that would invalidate the setup. If price breaks through your support/resistance cleanly, the trade idea is wrong — regardless of what the RSI forecast suggested.
6. Review Your Results by Setup Type
When journaling, don't ask whether RSI prediction "worked" in general. Ask specific questions: Did it help with pullback reversals in uptrends? Did it keep you out of early counter-trend fades? Did it improve timing on range-edge trades? That's how you turn a tool into an edge.
Three Setups Where Predictive RSI Analysis Excels
1. Trend Pullback Reversals
In a healthy uptrend, RSI often pulls back toward 50 (or slightly below) before the next leg higher. A predictive RSI model can help you see when that pullback is likely ending — before the bounce becomes obvious. This is especially useful for traders who want to join trends but keep missing the clean re-entry points.
2. Range-Edge Reversals
When a market is rotating between clear support and resistance, RSI tends to reach extremes at the edges. Predictive analysis helps you distinguish between range edges where RSI is likely to reverse quickly versus situations where momentum might carry price through the level (potential breakout).
3. Divergence Confirmation
RSI divergence (price makes new high, RSI makes lower high) is a classic reversal signal — but divergences can persist longer than expected. AI prediction helps you see whether the divergence is likely to resolve soon (favoring reversal) or whether momentum might continue despite the divergence (favoring patience).
Common Mistakes When Using Predictive RSI Tools
- Trading every forecast: Prediction is a filter, not a trigger. Not every forecasted reversal deserves a trade.
- Ignoring price structure: RSI forecasts matter most at meaningful levels. In the middle of a range, they're far less useful.
- Overriding your plan: If your setup requires price confirmation, don't enter early just because the forecast looks compelling.
- Changing timeframes constantly: RSI behavior differs across timeframes. Pick one primary timeframe for your setups and stick with it long enough to learn the patterns.
- Expecting perfection: AI prediction improves probability — it doesn't guarantee outcomes. Some forecasts will be wrong. That's normal.
Why Cross-Platform Access Matters for RSI Trading
RSI setups don't only form when you're at your desk. Markets move during commute hours, lunch breaks, and evenings. That's why having predictive RSI analysis available across all your devices matters.
PredictIndicators.ai syncs your RSI forecasts and alerts across NinjaTrader 8, MetaTrader 5, iPhone, iPad, Android phones and tablets, Mac app, and web platform. Set an alert on your desktop in the morning, get notified on your phone during the day, review the setup on your tablet in the evening — all from one account.
If you want to explore platform-specific setups, visit the NinjaTrader page for futures traders, the MetaTrader page for forex/CFD traders, or the iPhone page for mobile-first workflows.
Final Takeaway
RSI remains one of the most useful momentum tools in trading — but its lagging nature has always been a limitation. AI prediction doesn't eliminate that lag entirely, but it compresses it significantly by showing you where RSI is likely to go before it gets there.
The result isn't more trades. It's better-timed trades at levels where reversals actually matter. When you can see RSI momentum fading before the cross prints, you give yourself time to evaluate the setup calmly instead of reacting after the move has already started.
For traders already using RSI as part of their workflow, adding predictive analysis is one of the highest-value upgrades available in 2026. PredictIndicators.ai makes that upgrade accessible across every platform you trade on — desktop, mobile, tablet, Mac, or web.