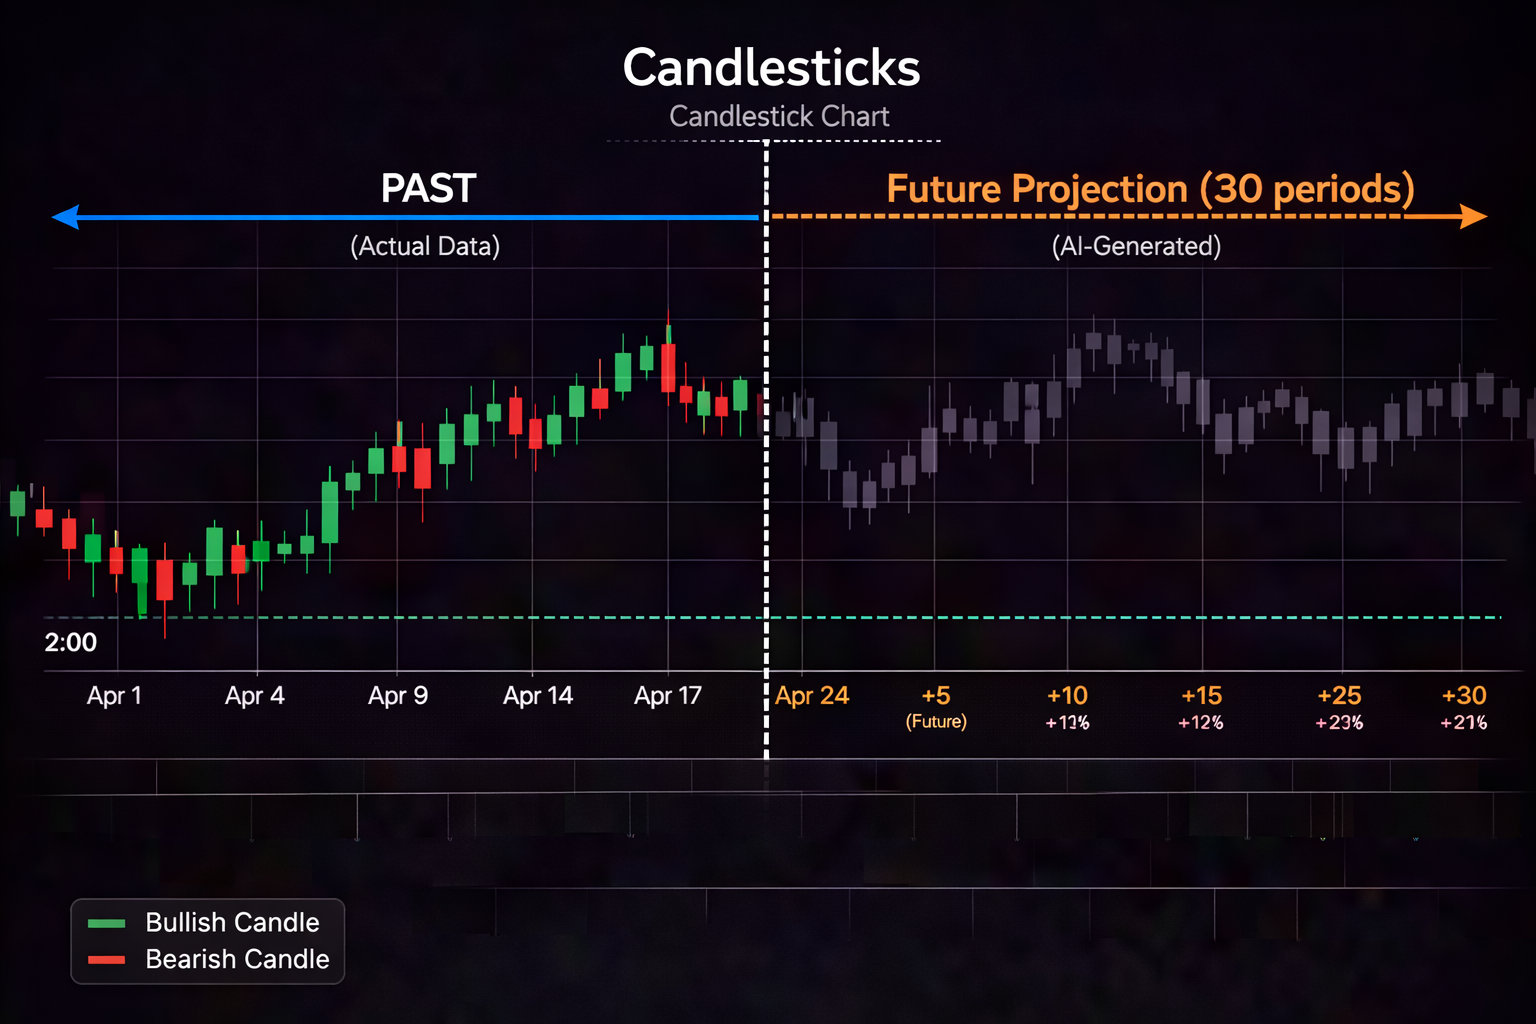
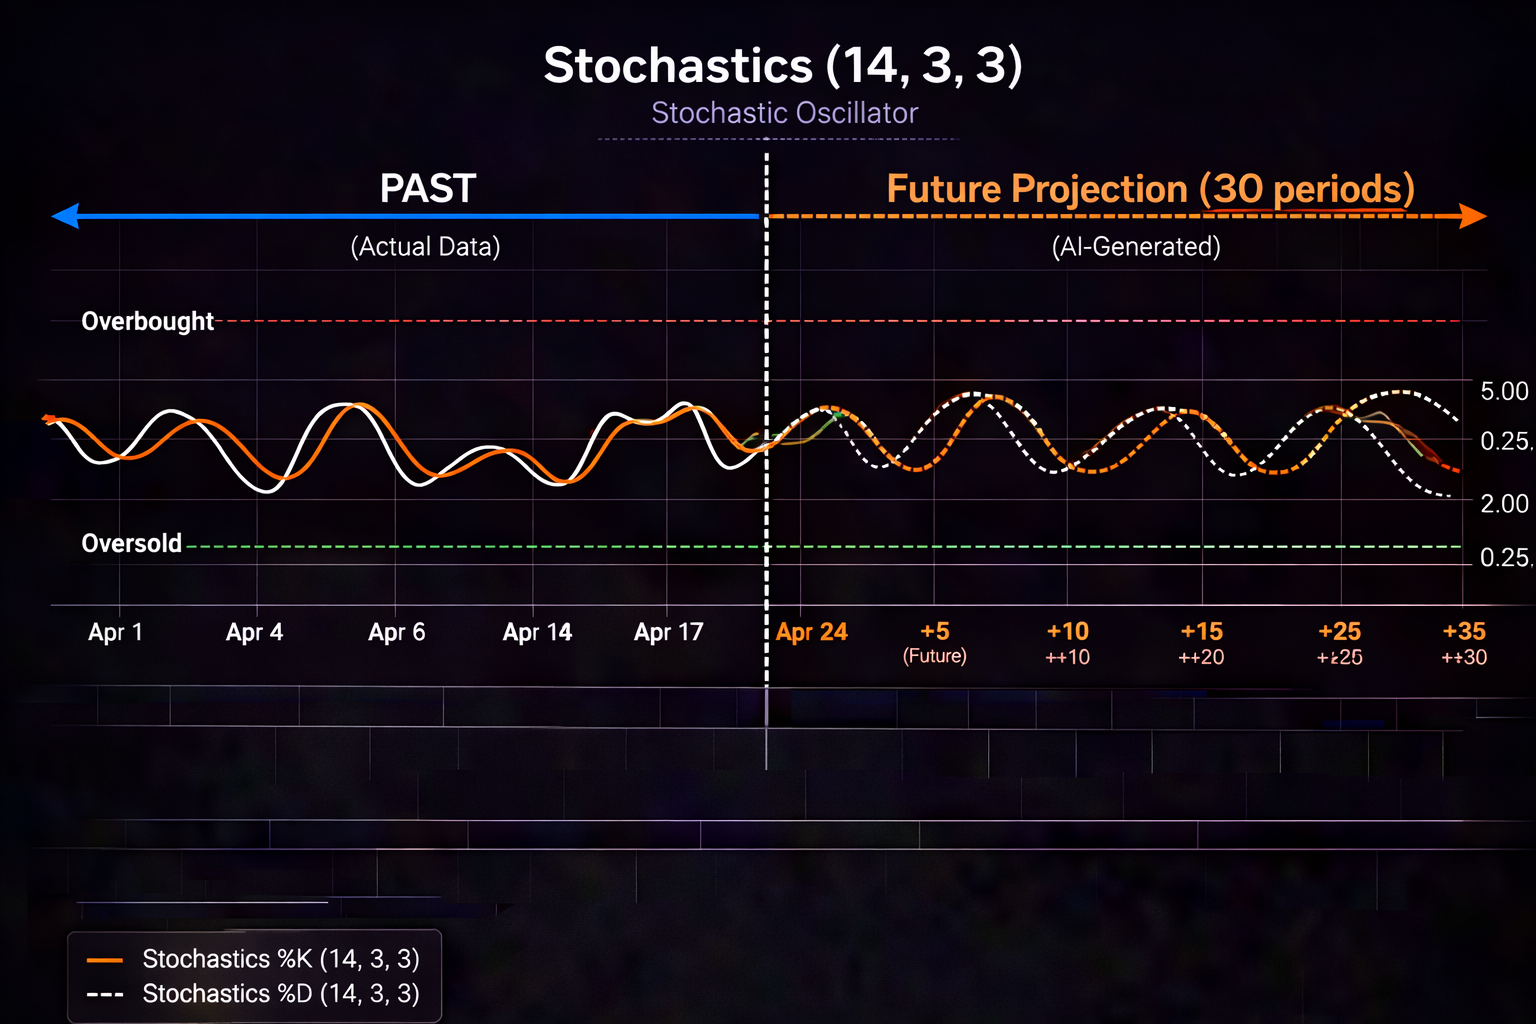
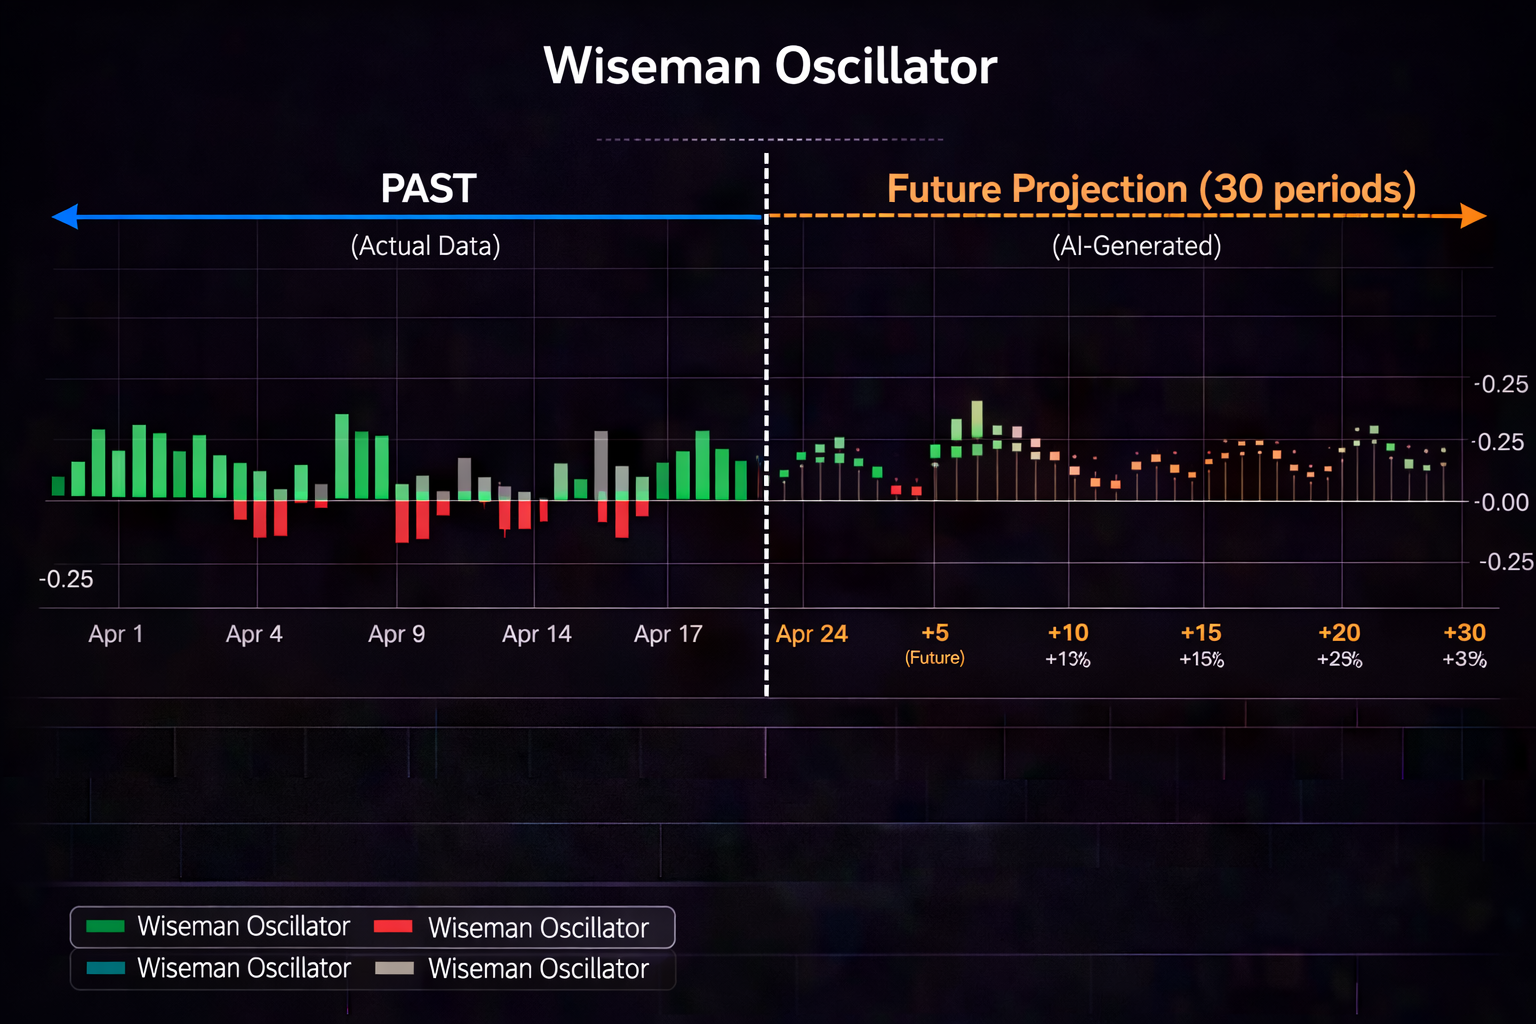
If you're a swing trader, you know the challenge: you need enough information to make confident decisions, but not so much that you're paralyzed by analysis.
If you're a swing trader, you know the challenge: you need enough information to make confident decisions, but not so much that you're paralyzed by analysis.
AI-powered indicators promise to cut through the noise. But which ones actually deliver?
After testing dozens of AI tools and building our own platform at PredictIndicators.ai, I've identified five indicators that genuinely help swing traders.
Traditional indicators are formula-based. AI indicators use pattern recognition to identify setups that have historically led to certain outcomes. They're saying: "This pattern looks like patterns that preceded moves in the past."
Identifies price levels where significant buying or selling has occurred historically. Shows clusters—zones where multiple historical reactions happened.
Swing trading is about buying near support and selling near resistance. Clusters give you zones rather than exact prices, matching market reality better.
Tracks where volume has historically concentrated, then flags when current volume deviates significantly from normal.
Volume confirms or contradicts price moves. AI normalizes by comparing current volume to historical patterns for that specific stock.
Measures whether a trend is strengthening or weakening by analyzing velocity of moves, pullback depth, and recovery speed.
The hardest part of swing trading isn't finding trends—it's knowing when they're ending. This is a leading indicator showing weakening before reversal.
Tracks how closely a stock correlates with its sector, flags when relationship changes.
When a stock stops moving with its sector, something's happening. Positive divergence (stock up, sector down) shows relative strength. Negative divergence shows weakness.
Identifies classical chart patterns and shows historical completion rate for similar patterns.
Chart patterns are subjective. This removes guesswork by showing pattern identification, maturity, historical success rate, and typical targets.
These indicators work best together. A complete analysis might show: support cluster at entry, volume anomaly confirming accumulation, trend decay ending, positive sector divergence, and pattern near completion. That's a high-quality setup.
At PredictIndicators.ai, we've built all five indicators into our platform with:
Start your 3-day free trial at PredictIndicators.ai — no credit card required.
Content creator? Check out our influencer program.